ilert AI SRE is generally available



When you get paged at 3am, it takes about 30 seconds for the notification to reach you and maybe two minutes until you're in front of a laptop, awake enough to read. What you see then is usually a raw alert. A metric name, a threshold, a link to a dashboard. Then the ritual starts: open the dashboard, check what deployed in the last few hours, grep the logs for the first error, ask in Slack whether anyone touched the database.
Most of that time is search. Once you've found the needle in the haystack, the fix is usually fast, and most of the time it's a rollback. It's the search that takes 20, 45, sometimes 60 minutes of your night.
The goal for ilert AI SRE was simple to state: by the time you open the laptop, the search should be done. We opened the closed beta about a year ago, back then under the name ilert Responder, with a few teams. Since then we've rebuilt the agent three times, and each rebuild taught us something the previous version didn't know: where an agent actually helps, what a good harness looks like, and what "production-ready" means when the agent is on call next to you. Today it's generally available on every paid plan and during trials.
What it does
Give AI SRE an alert from any of our 150+ integrations and it investigates the way you would, just faster. It looks at logs, metrics and traces. It looks at what changed, because change is the number one cause of incidents: deployments, config changes, merged pull requests, and, if you've connected your repository, the actual diff. If 50 alerts fire at once, it first triages them into clusters and investigates each cluster on its own.
A few minutes later, you're not looking at a blank alert. You're looking at a root cause analysis.
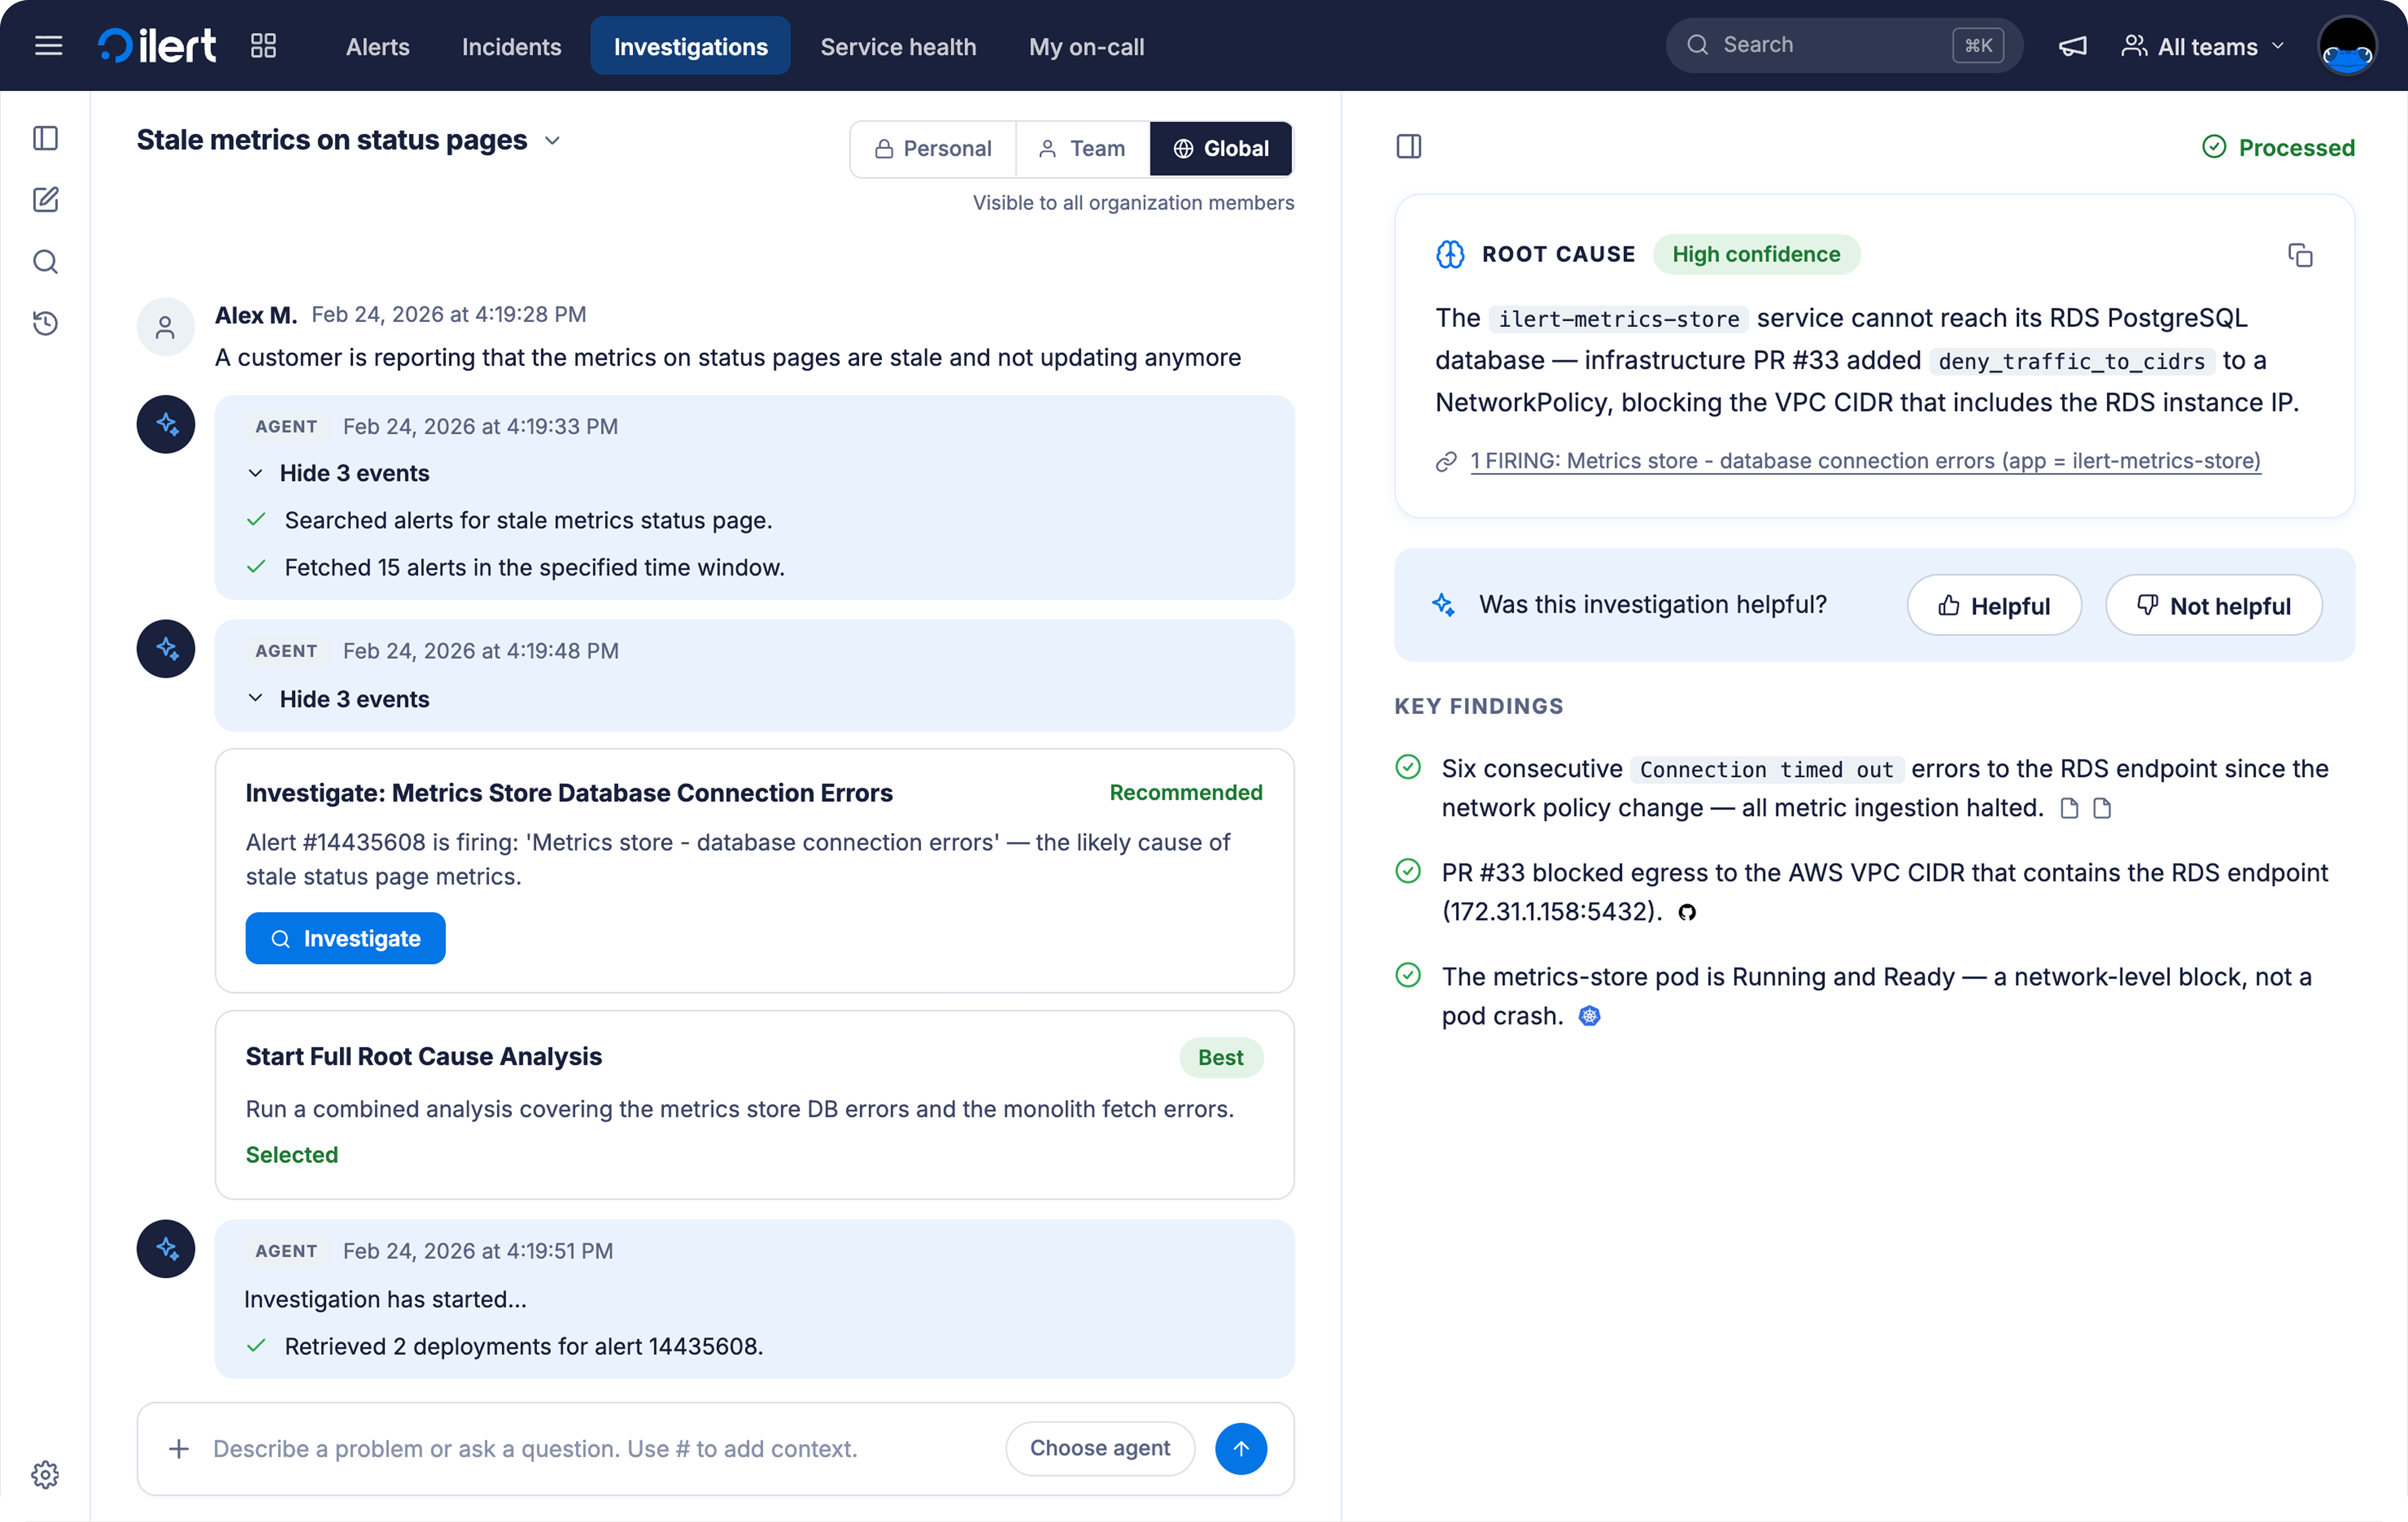
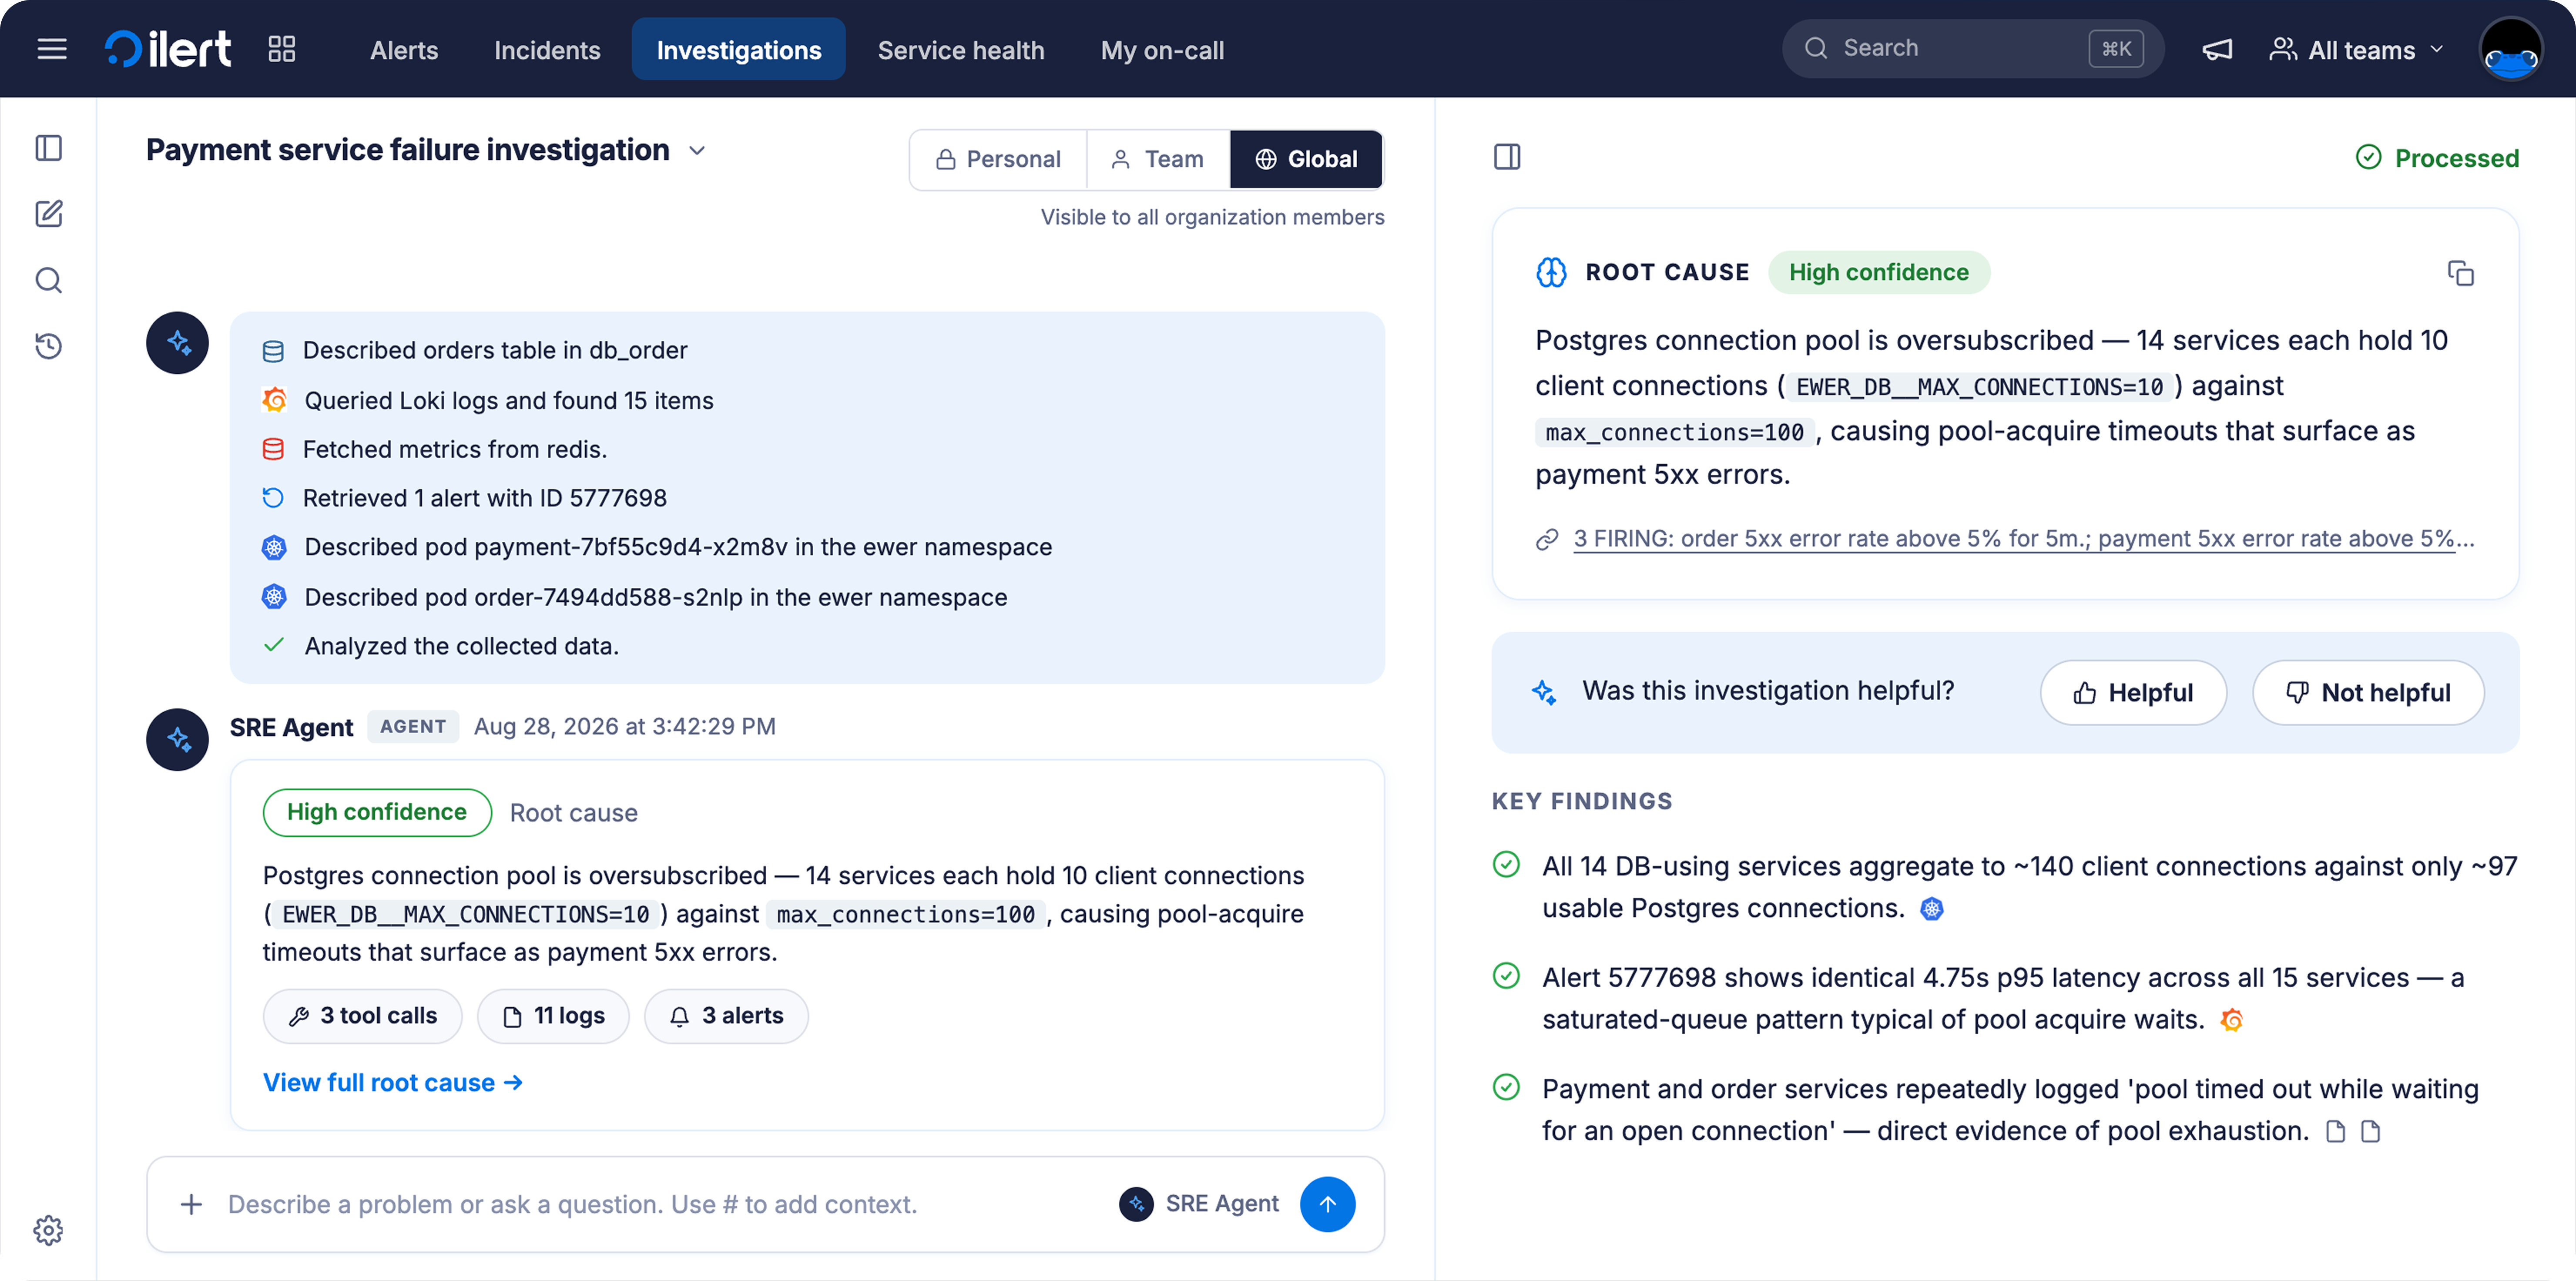
Every investigation has the same shape. A hypothesis for the root cause, with a confidence label: high, medium or low. Five or six key findings, and every finding links to its evidence: the deployment it's referring to, the log line that produced the out-of-memory error, the metric that broke first. A short list of things it ruled out. And, where it makes sense, a proposed action: roll back to the last healthy version, double the memory on that pod, restart the service.
Then it waits for you. You make the call. Nothing changes the state of your system without an engineer clicking approve.
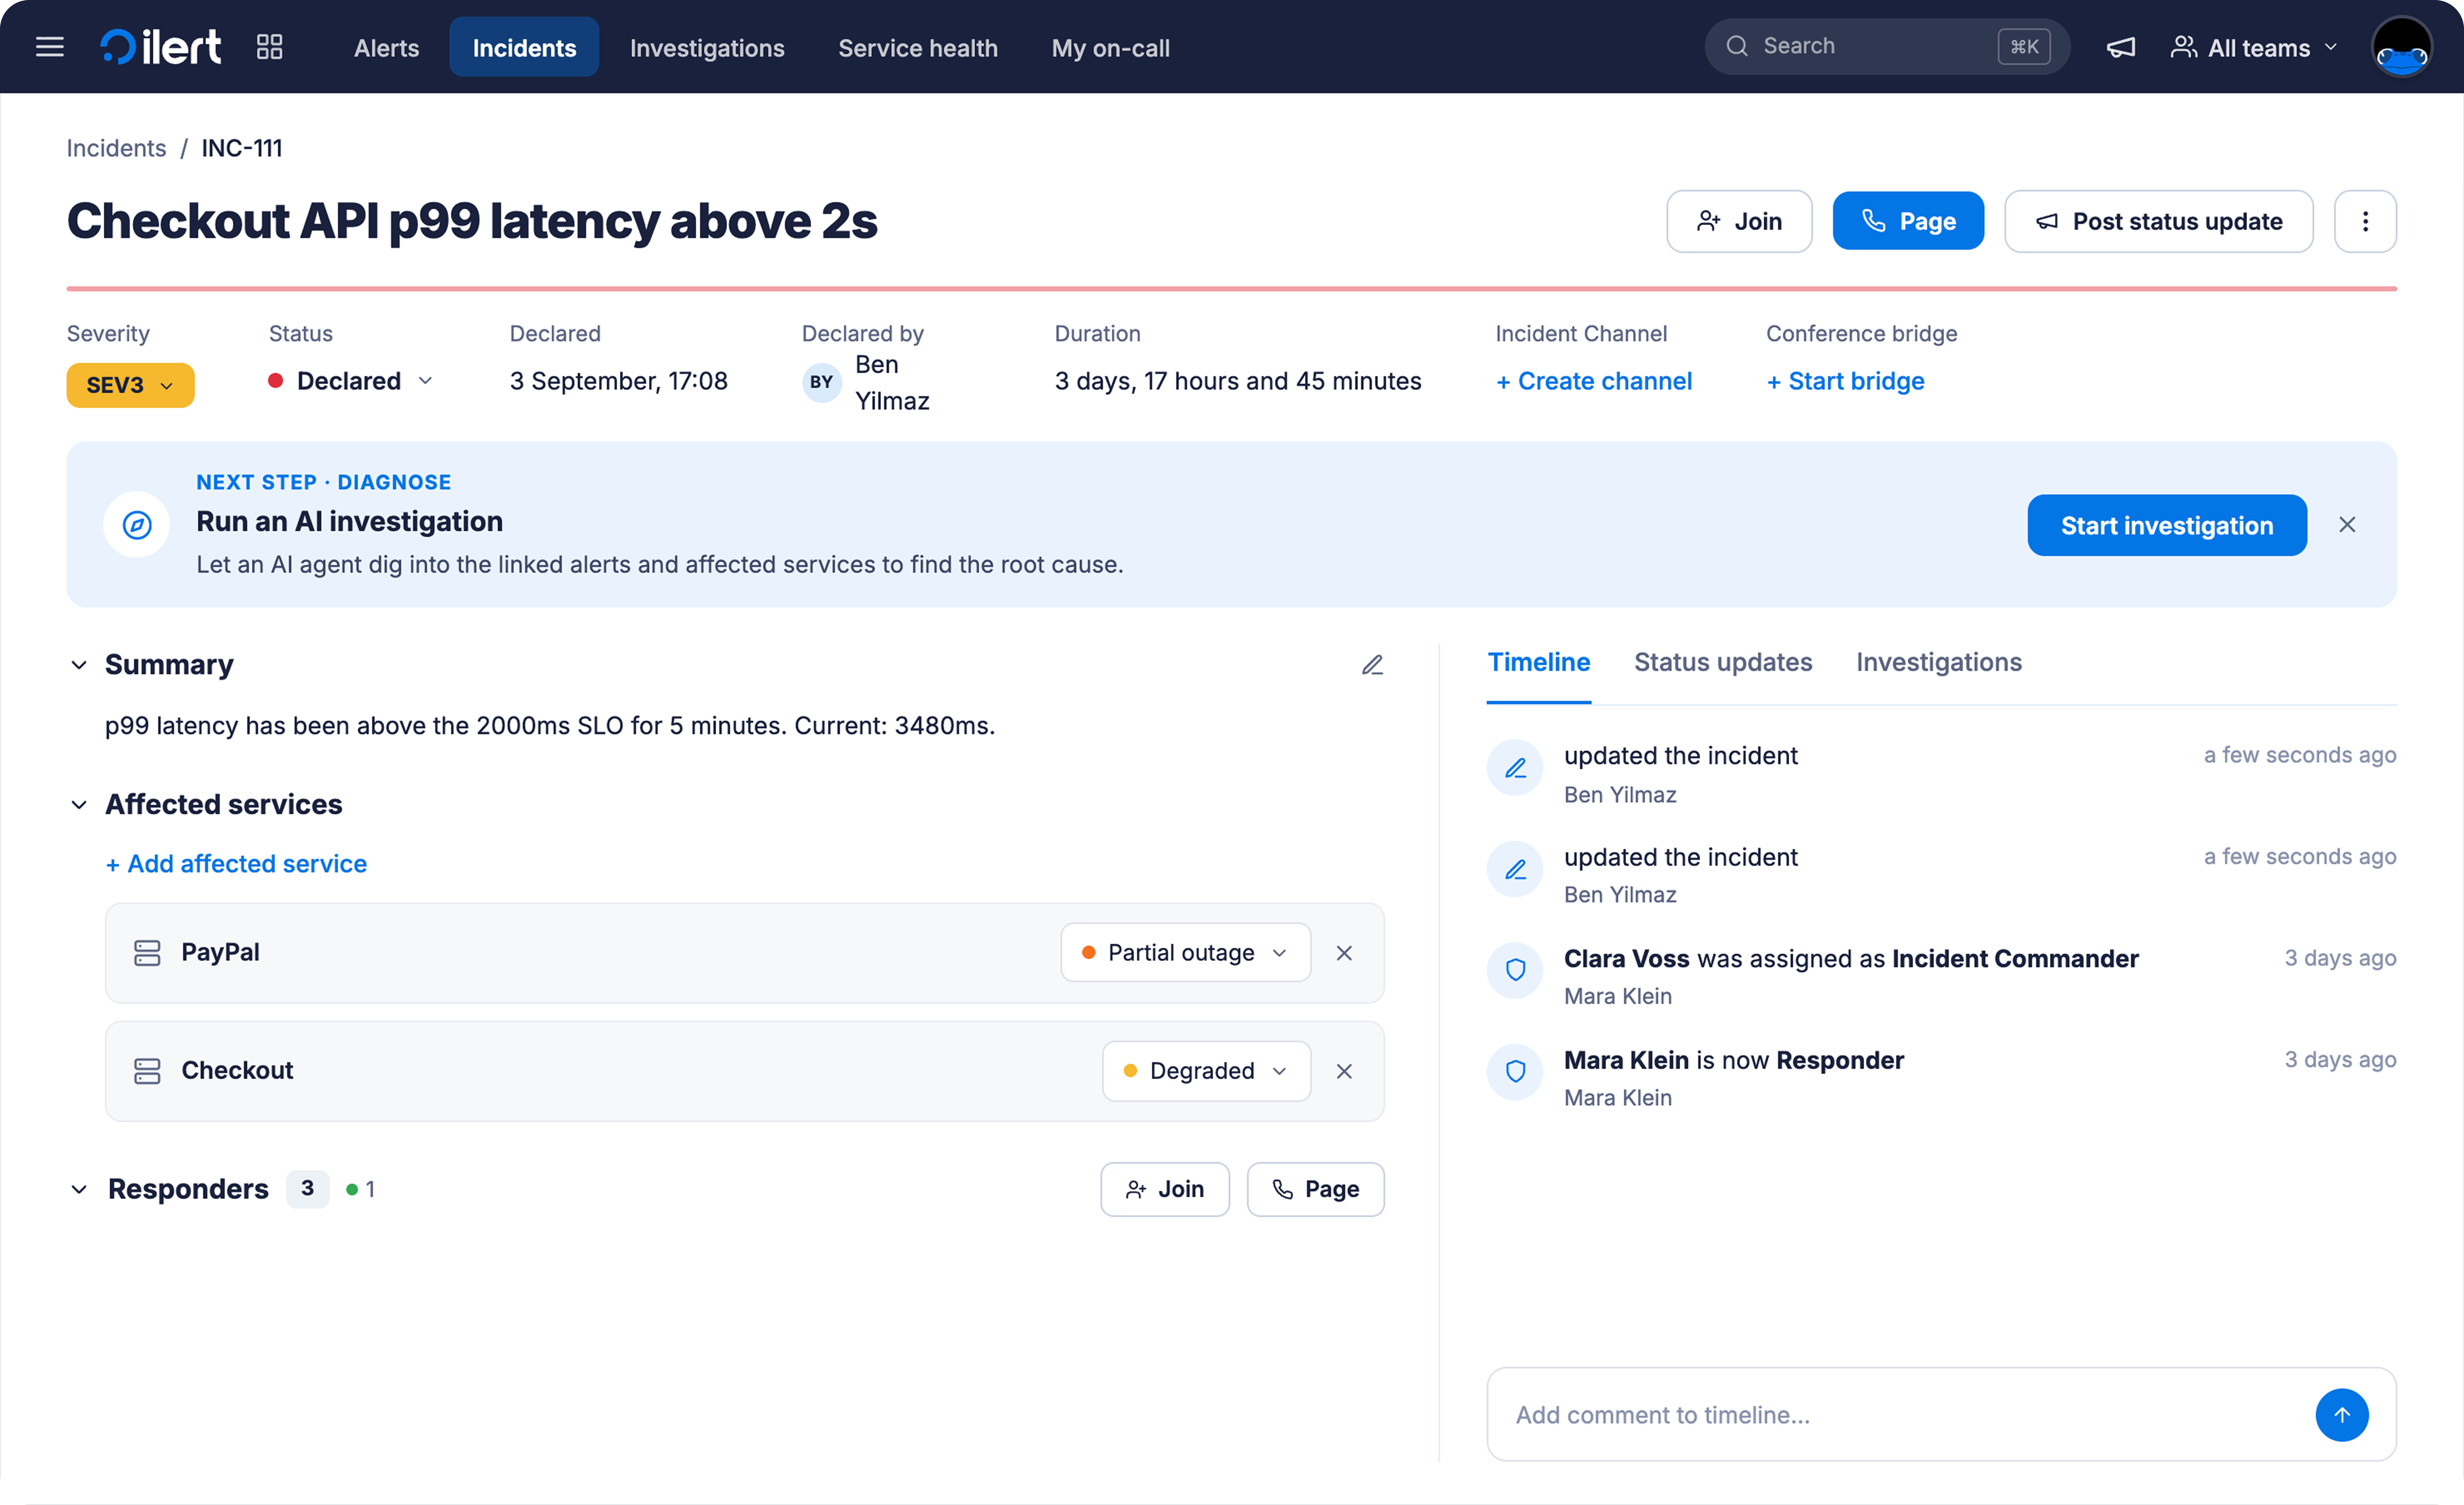
At GA, you start the investigation. There are three ways in: from an alert, from an incident, or by describing what you're seeing in the agent's chat. Plain language is enough; "customers are reporting that metrics on their status pages are stale" is a complete brief, and it's how the incident in the next section was handed to the agent. Investigations that start on their own the moment an alert fires, so the analysis is already waiting when you pick up the phone, are the next step, not this one.
A real one
A while ago we had an external penetration test. It found a blind SSRF in the metrics feature of our status pages: customers can point a status page at their Datadog or Prometheus to display API response times, and an attacker could try to make that fetcher call internal URLs instead. We fixed it the same week with a Kubernetes network policy. The network policy was too broad. The metrics service could no longer talk to its own database, and metrics on customer status pages went stale.
I like this incident as a test case for two reasons. First, no runbook on earth covers "after a pentest fix, status page metrics go stale." Novel incidents don't have runbooks. Second, the symptom is ambiguous: tell an agent "customers say metrics stopped working" and there are a dozen internal things called metrics it could chase, including our entire Prometheus setup. The agent had to find candidate pods, find the logs showing a service that couldn't reach its database, then walk the recent changes until it landed on the network policy. That's the kind of search that eats an hour of a human's night, and it's exactly the kind of search the agent is good at.
Why there is no autonomous mode at GA
We think about autonomy in levels. Observe only: the agent has read-only access and produces an analysis. Propose: the agent suggests an action and a human approves it. Pre-approved actions: a class of low-risk actions the agent may run on its own when its confidence is high. Fully autonomous: you only get paged when the agent is stuck.
GA ships the first two. I want to be direct about why, because the usefulness of an agent grows with its autonomy. A self-driving car that needs you watching the road is helpful; one that doesn't is a different product. I believe we'll get there, and I think production agents will reach the maturity coding agents reached over the last year. But I don't have a way to do full autonomy safely today, so I wouldn't run it today, and I don't think you should either. We run demos where the agent does everything end to end, from investigation to status page update to fix, and we always add: don't do this at home.
Observe-and-propose is not a consolation prize. Read-only access means that even if the agent goes badly wrong, the blast radius is an incorrect document. And most of the time you spend on an incident is the root cause analysis. Cutting that from 45 minutes to a few is the bulk of the value, before the agent ever touches anything.
What it reads, and what it deliberately doesn't
The best documentation of how a system actually works is the code and the live telemetry. Everything else goes stale. So AI SRE doesn't start from your Confluence, your Notion or your runbooks. Pointing an agent at a wiki with hundreds of runbooks, the last of which was updated three years ago, causes more damage than it produces results.
What it does read is everything you already send to ilert, plus what you connect: logs from Elastic or CloudWatch, dashboards and metrics from Grafana, Prometheus or InfluxDB, your Kubernetes cluster, your GitHub repositories and CI/CD pipeline. That breadth is the point. Every observability vendor is building an AI SRE right now, and each one sees its own slice. We sit on top of all of them, we stay vendor-neutral, and if your observability tool produces its own RCA, we take it as one input among many. Nobody wants another siloed tool that only does RCA for one data source.
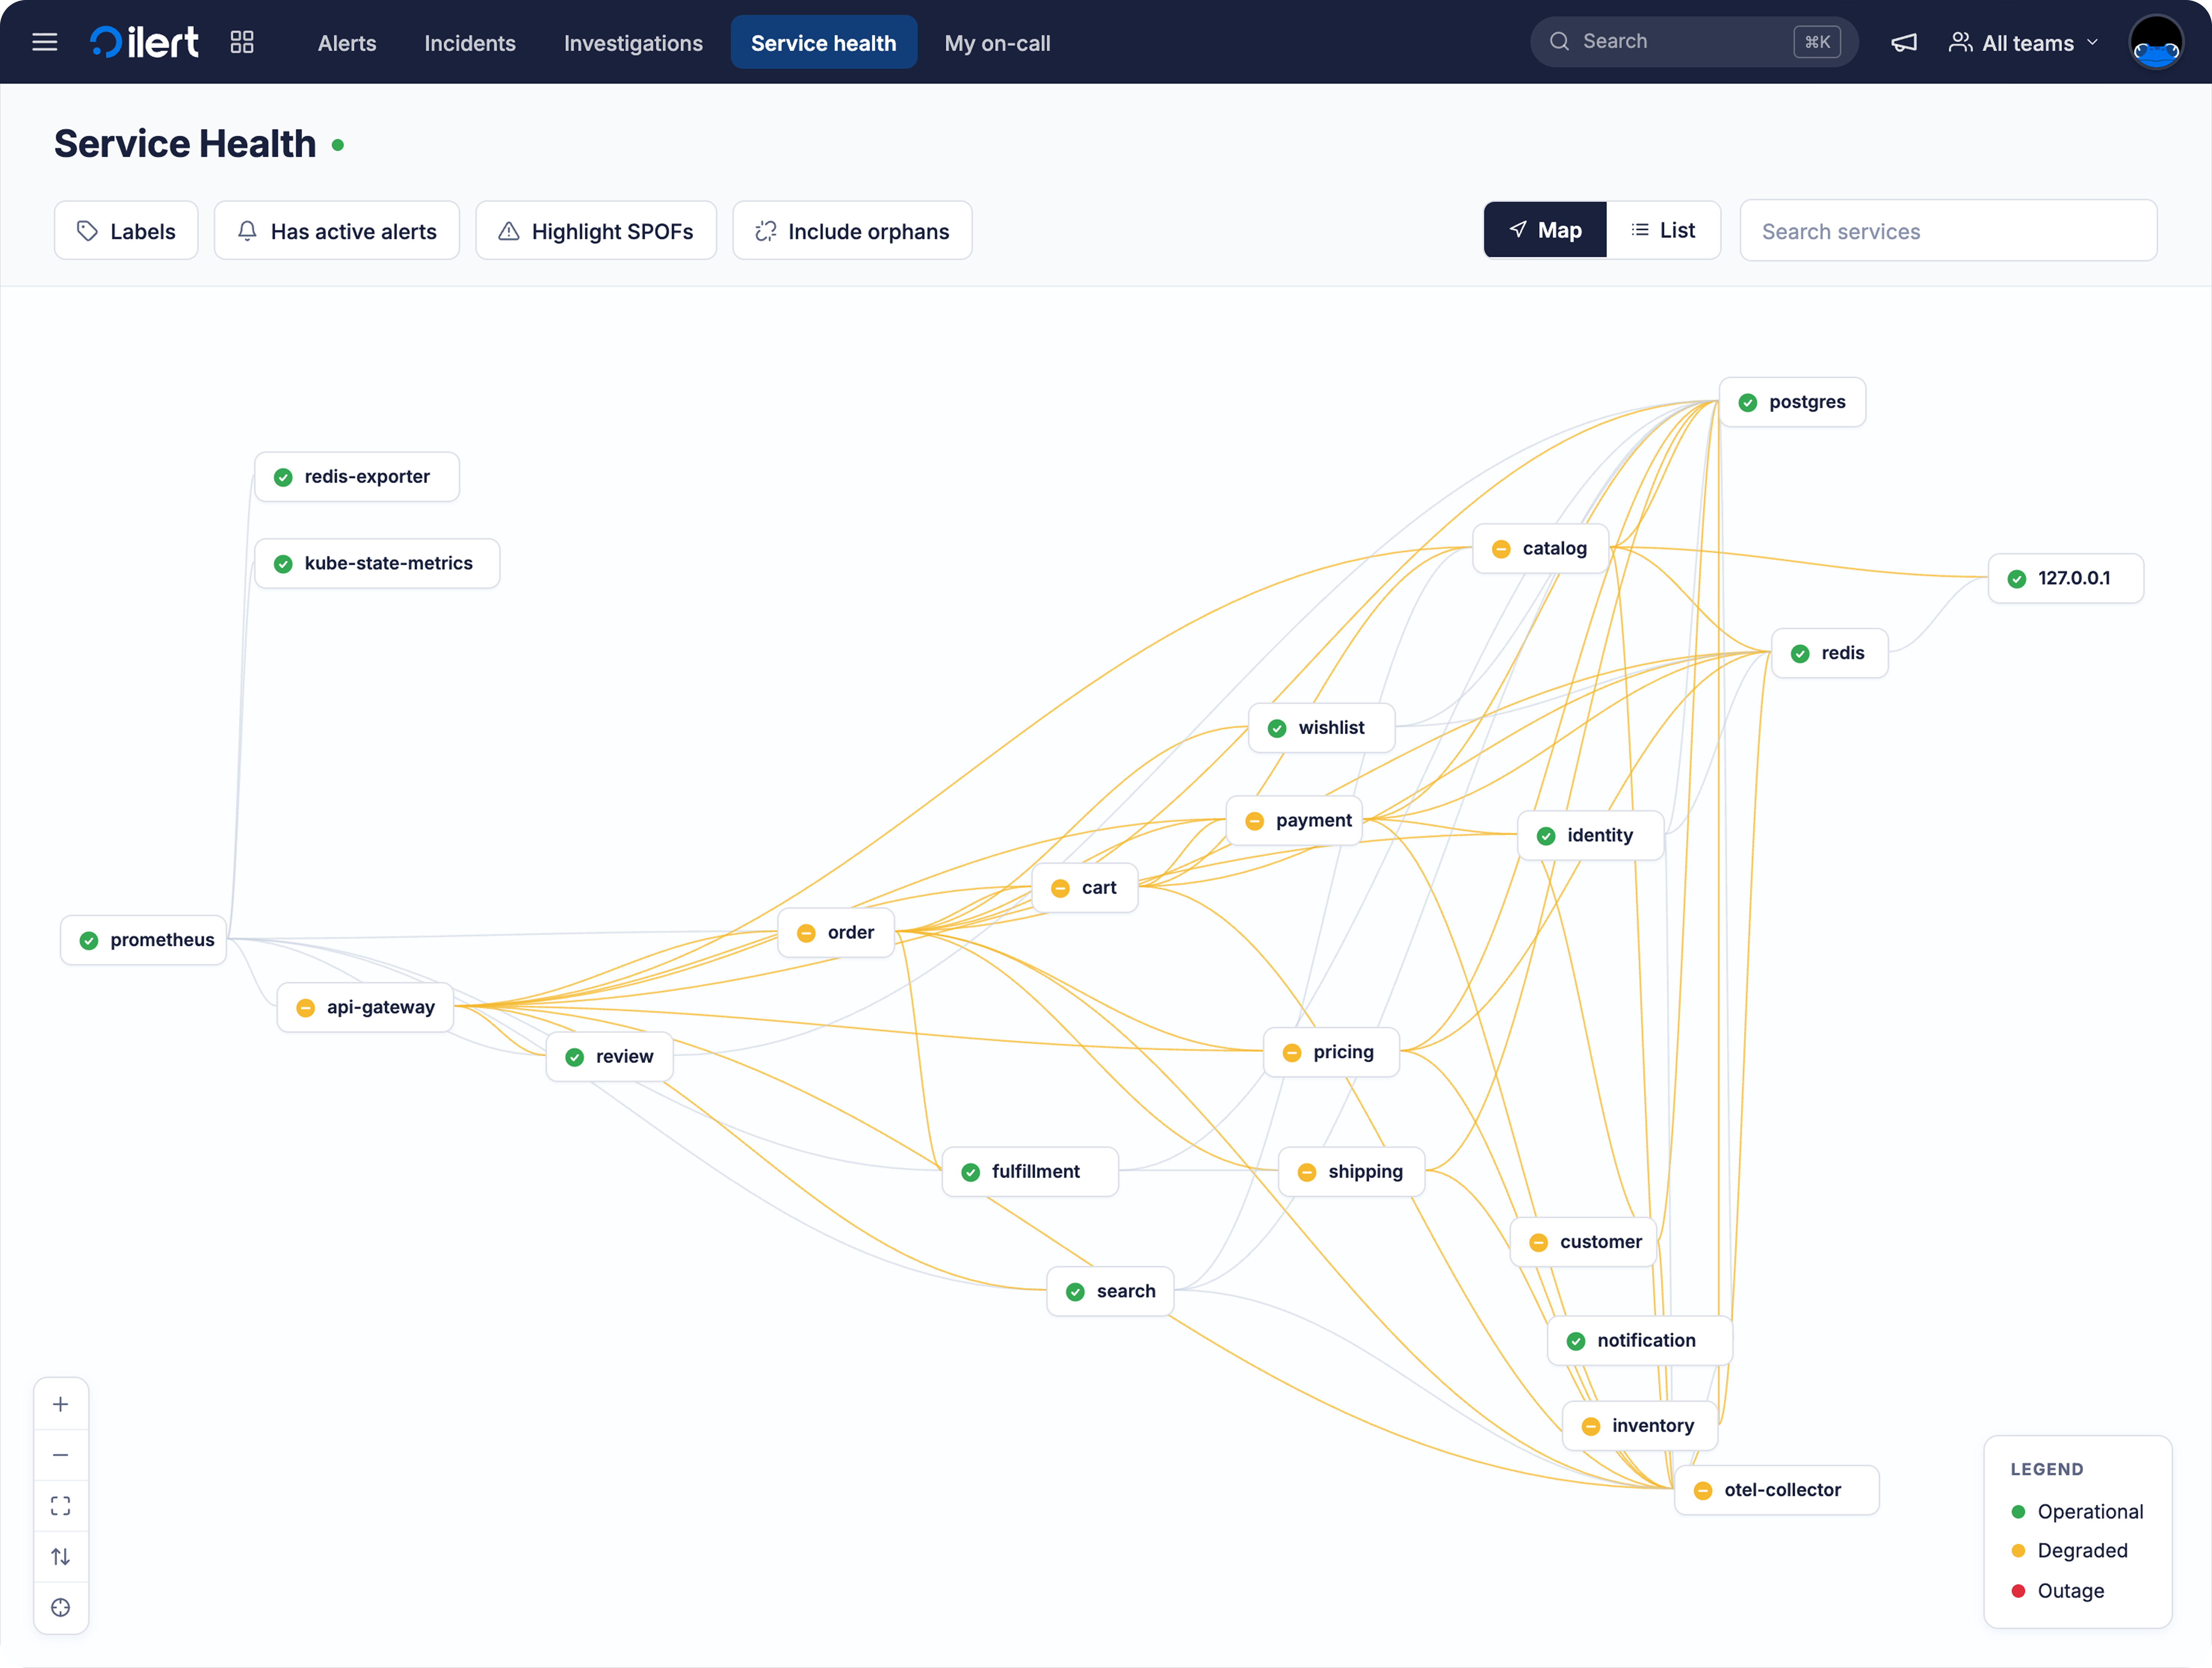
Beyond what you connect, the agent runs a discovery phase when you set it up, and again whenever it's been idle for a while. It builds a service topology from live tracing data, so it understands your dependencies without anyone maintaining a service catalog by hand. That topology is also what allows our agent to do cost-effective alert triage before running an investigation with powerful (but more expensive) reasoning models. If you don't have tracing instrumented, and most companies don't, you can drop an eBPF collector into your cluster and get most of the way there without touching code.
Over time the agent keeps a lightweight long-term memory of the tribal knowledge it picks up, the "this service always hits its limits at midnight because of the batch jobs" kind of thing. It's plain text. There's no vector database to keep in sync.
How we test it
There is no recipe for root cause analysis, which makes it hard to test. We do three things.
First, a public benchmark. OpenRCA, from Microsoft Research, is the hardest public test of root cause analysis I know of: 335 real failure cases from three production systems, 68 GB of telemetry, scored all-or-nothing per task. What counts as a full point depends on the task: some require the right component, reason, and time; others are scored on a smaller subset, sometimes just the component. At paper release, the best published baseline, an agent on Claude 3.5 Sonnet, solved about 11% of the cases. By the time we ran our own benchmark, later leaderboard results had moved on, Opus 4.6 sat at roughly 36%, so treat that 11% as the paper's number, not today's frontier.
On a 50-task sample across all three systems, our first prototype solved 26% under that strict rule, and matched the ground truth in 30% of cases by the broader measure, at roughly nine minutes per investigation. I'd treat the number as a floor, and the sample size as the caveat it is, but two things we learned matter more than the number. Handing the agent a plain shell on the raw telemetry nearly doubled the strict pass rate compared to handing it our eight production-shaped Grafana and Prometheus tools, 26% against 14%, with fewer tool calls. Tool design is not a detail. And OpenRCA is telemetry only: no deployment history, no config changes, no alerts. In production, changes are the agent's strongest signal, so this benchmark measures it with one hand tied behind its back. In the same run, Claude Code carrying our investigator prompt scored 38%, ahead of our own harness. We publish that because it's the test we hold ourselves to internally: if a general coding agent with your prompt beats your harness, your harness has work to do.
Second, chaos. We inject real faults into a real environment and hand the agent only what an on-call engineer would see: the symptoms. It's never told what we broke. Across a dozen scenarios covering bad deploys, config regressions, resource exhaustion, dependency failures:
- Correct root cause identified in all runs
- Median time from alert to first finding: 194 seconds
- Proposed remediation matched what our engineers would have done in 90% of runs
- Wrong hypothesis presented with high confidence: Zero. This is the number we watch most closely.
Third, replay. Every production investigation is recorded: every tool call, every response, the final RCA. When we change a model or a prompt, we replay those recordings and compare the outcome, with an LLM as judge and with embedding similarity. This catches regressions when a new model comes out. It doesn't catch everything: a recording only covers the tools the original run happened to use.
The agent is sometimes wrong. Not hallucinating-wrong; in a highly contextualized environment we see very little of that. Plain wrong: a confident line from the symptoms to the wrong cause. The confidence label and the evidence links exist so you can see that in under a minute, and either redirect it with a follow-up question or do the analysis yourself.
What it doesn't do
It won't act on its own. Every action requires approval.
It only sees what you connect. Most of the value of an agent is in the context it gets. If it can't see that something deployed, it can't blame the deploy.
It won't fix not having observability. Some people hope the agent lets them skip that step. It doesn't, at least not yet.
It's not great at backing out of a wrong path on its own. When the search space is large and the starting point is vague, it can get stuck. That's when you ask for a follow-up or take over.
What this changes for the team
The conversations we're having with engineering leaders about this are different from the ones we used to have about MTTR. A pattern I keep seeing: a small, strong SRE team runs first-line on-call across many product teams, with the agent doing the triage and the first investigation. Fair rotations normally force every service team to staff around five people just to cover on-call. Centralizing first-line on an AI-augmented team removes that constraint per team. Engineers spend more of their time shipping and less of it in 25-person incident bridges. Same headcount, more services, lower cost per incident.
That's the version of "AI in operations" I find worth building: not fewer engineers, but engineers who were hired to build things getting to build things. Nobody was hired to be on call full-time.
Your data
All AI workloads run on dedicated infrastructure in our EU regions, Frankfurt and Stockholm, and models are called through regional endpoints. We don't train on your data and have opted out of training with every model provider we use. Read-only API keys are all the agent needs to investigate. Personal and user-level data isn't shared with external models. If your security team wants to bring your own model API keys behind your own guardrails, we support that. Details: https://docs.ilert.com/trust-center
Availability
AI SRE is on for every paid plan and for trials starting today, running on the AI credits included in your plan: 250 per month on Pro, 1,000 on Scale, 5,000 on Enterprise. You can see your baseline and decide what happens when you run out.
Existing customers: nothing to migrate. Enable it under Account settings → AI features, create an agent and connect it with your tools, and launch your first investigation from the next incident.
Where this goes
The end state we're building toward is that you're not paged at 3am at all. You wake up to a report: the agent stopped the bleeding, verified for an hour that the symptoms were gone, and there's a pull request for the real fix. That's not GA. GA is the search taking a few minutes instead of an hour, started with one click, with the fix one click behind it. The trust for the rest gets earned one investigation at a time, and this is where it starts.
If you have a scenario you think it will get wrong, I want to hear about it.
.avif)