New Features: AI Help for On-call Schedules, Event Explorer, and Revamped Status Page Designs


We're thrilled to announce the latest enhancements to ilert AI in our most recent update. For those eager to dive into AI functionalities firsthand, we invite you to reach out to us at support@ilert.com. We'd be more than happy to welcome you into our Beta program. Moreover, we always appreciate your input on the ilert roadmap and look forward to hearing your innovative feature suggestions. Now, let's delve into the exciting new updates!
AI-assisted On-call Schedule Creation (Beta)
The newest update integrates ilert AI into on-call scheduling, making the process smoother than ever. Through a conversational interface, simply share your scheduling requirements, including your team members' names, rotation frequency, and times, and let AI handle the rest. To experience this seamless scheduling, click the "Generate schedule with ilert AI" button. For those yet to explore ilert AI, we strongly recommend experimenting with AI-assisted incident communication and our latest addition — automated postmortem reports.
Event Explorer: Comprehensive Insights into Your Alerts
Get a 360-degree view of alerts from your alert sources — with the Event Explorer feature. You can now see all the information about the events in JSON format, including the event body, triggered alert actions, and how exactly the event was converted in ilert. Event Explorer facilitates the search for specific events linked to alert sources using keywords or time frames. Try this feature by navigating to your alert sources and clicking the "Event Explorer" tab located beneath the source title. Please note that Event Explorer is available for a selected list of alert sources, with event history available from March 2022 and alert correlations from December 2023 onwards.
Priority Mapping
You can use alert payload fields to extract and map notification priority. If you switch this feature on, it will overwrite the default priority set up in ilert. For example, if you configure your Prometheus Alertmanager to include a severity label in the alert payload, you could configure your Prometheus alert source in ilert to map the severity value "info" to low priority, and the label "critical" and "warning" to high priority.
.avif)
Dynamic Link Enrichment
Enhancements to alert settings now include the ability to dynamically extract links from alert payloads, providing immediate access to crucial information upon receiving an alert.
On top of that,
- Improved visibility for alert source features: discover the capabilities of each alert source more easily by clicking the "i" icon in the alert source wizard when creating a new alert source.
- Enhanced alert timeline: events related to incident creation and status page updates are now prominently displayed on the alert timeline, accessible on both desktop and mobile apps.
- Alert summary change on ilert mobile app: to access it, go to an alert that you're interested in and click a three dots icon.
More powerful Status Pages
Customization Flexibility
Firstly, we've broadened customization options available for your status page layout. You can now choose between a sleek single-column view or dynamic columns, showcasing items in an adaptable grid tailored to fit your screen size. And a reminder, you can also pick up light or dark themes to match your brand's aesthetic or personal preference.
Subscriber Management Enhancements
Secondly, you can easily export your status page subscribers in a CSV file for quick reference and management. This way, you can quickly check who has subscribed to your status page.
Branding Consistency and Localization
The opt-in emails have been updated to reflect your branding more consistently, featuring the same logo as your status page. Moreover, for customers whose browser language is set to German, both the opt-in email and the main elements of the status page will automatically be localized, providing a seamless experience for your German-speaking audience.
Incident Filtering by Status Pages
An additional update includes a new filter option in the incidents tab within ilert. The "Status Pages" filter allows you to specifically view incidents that were displayed on certain status pages, enhancing your ability to track and manage incidents relevant to your audience.
Enhanced ChatOps
Microsoft Teams users will have noticed substantial improvements in ilert notifications. We've undertaken a comprehensive overhaul to ensure that messages are more visually appealing, clearer, and more structured. You can notice what status the incident is in even at a cursory glance—all thanks to the color indicators that accompany each notification.
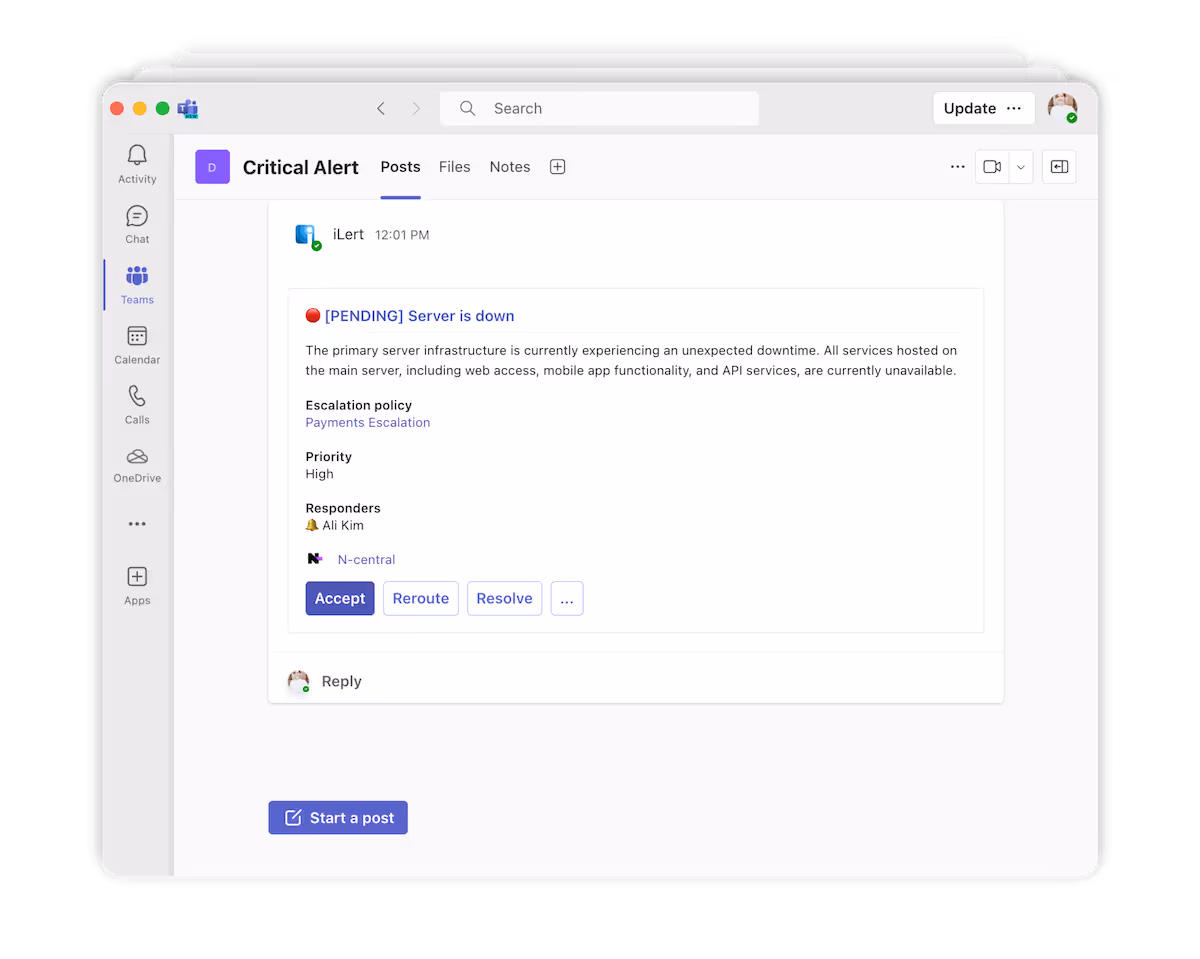
Furthermore, both Microsoft Teams and Slack now include incident communication actions. For example, you can add affected services during an incident without leaving your chat tool.
More ilert Terraform capabilities
Our commitment to integrating monitoring and alerting with Infrastructure as Code (IaC) practices continues to grow with the latest updates to ilert's Terraform provider. New status page fields have been added, offering you more control over the layout directly from your Terraform scripts. Additionally, we've introduced new fields for alert source templates, further enhancing your ability to automate and customize your monitoring setup. Check the updates in Terraform registry.

New Integrations
To further simplify the connection between your monitoring tools and the ilert incident management platform, we've rolled out an extensive list of new integrations. These integrations are designed to facilitate a seamless flow of information, ensuring that your incident management processes are more efficient and less prone to errors.
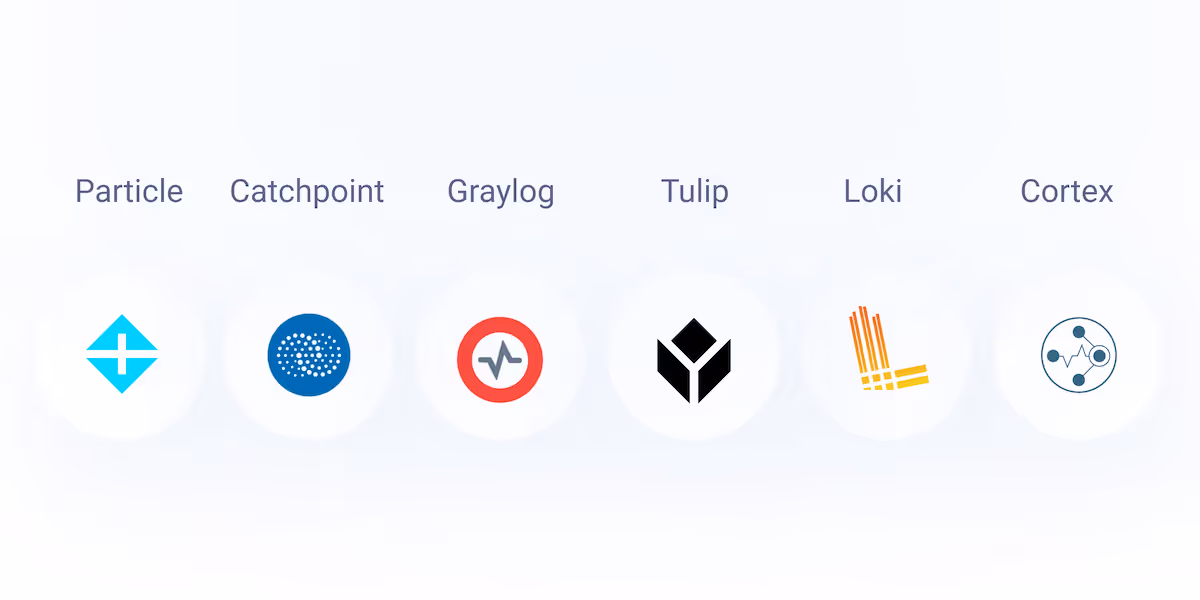
Loki
Loki is a log aggregation system by Grafana Labs, designed for storing and querying logs, inspired by Prometheus, which focuses on metrics. Loki uses a similar label-based system for data organization, making it compatible with Prometheus users. It complements Prometheus by offering efficient log management, allowing users to analyze operational aspects of their systems alongside metric-based monitoring. Here are the instructions on how to connect ilert and Loki.
Cortex
Cortex is a scalable, multi-tenant solution for long-term Prometheus metrics storage, enabling larger-scale and high-availability Prometheus deployments. It aggregates metrics from multiple Prometheus instances, offering centralized management and querying of large data volumes. Cortex enhances Prometheus by providing horizontal scalability and long-term durability, maintaining compatibility with Prometheus's query language and tooling for efficient monitoring infrastructure scaling. Check documentation to integrate ilert with Cortex.
Mimir
Mimir is a scalable, open-source storage system for Prometheus metrics, enhancing Prometheus with durable storage, high availability, and scalability. It aggregates metrics from multiple Prometheus instances for large-scale monitoring, while retaining compatibility with Prometheus's query language. Mimir facilitates robust monitoring in complex environments by improving Prometheus's scalability and reliability. Here is a step-by-step guide on how to connect Mimir and ilert.
Catchpoint
Catchpoint is a digital experience monitoring (DEM) platform that provides comprehensive visibility into the performance and availability of websites, applications, and services across various networks and devices. It helps organizations to detect, diagnose, and resolve performance issues before they impact end-users. If you are looking for Catchpoint integration, head to this documentation article.
Graylog
Graylog is an open-source log management tool that aggregates and analyzes log data across IT infrastructure and applications, enhancing security and operational efficiency. It offers real-time insights through intuitive searches and visualizations, facilitating quick issue resolution and trend analysis. Graylog streamlines log analysis, supports anomaly detection, and ensures smooth operations, serving as a vital resource for IT and security teams. Find more details on ilert integration for Graylog.
Telegram
Telegram is now on the list of ilert outbound integrations. It helps you to send alert notifications to Telegram 1:1 chats and group chats. Read the documentation article on this integration of Telegram and ilert.
Tulip
ilert also continues to grow its list of IoT integrations. Tulip is a cloud-based platform designed to enhance manufacturing operations through its no-code application development environment. It allows manufacturers to create custom apps that can guide workflows, monitor production processes in real-time, and analyze data for continuous improvement. By empowering shop floor workers with digital tools and providing managers with insightful analytics, Tulip facilitates the integration of the Internet of Things (IoT) devices, machine learning, and AI into manufacturing environments. Find ilert connector in Tulip's library.
Previous New Features Issues on ilert Blog:
New Features: AI-assisted postmortems, ilert Terraform updates, and expanded ChatOps capabilities