Top AI SRE tools in 2026



AI SRE tools take on the slowest part of incident response: figuring out why something broke. Work that used to take SREs hours, juggling countless tabs and a flood of Slack messages, can now be done in minutes.
The category grew fast in 2026, and the tools now differ a lot in how deep they investigate, what they’re allowed to change, and what happens to your data along the way. We looked into 10 AI SRE tools and the best use cases for each one.
A quick disclosure: we make ilert AI SRE. Everything about the other tools comes directly from their public websites and documentation, and was accurate as of November 2026.
AI SRE tools at a glance
Long story short
Most AI SRE tools work the same way on the surface: they read your logs, metrics and traces and come back with a root cause and evidence. Where they differ is where their context comes from (their own observability platform, your existing stack, or your incident platform), how they reason (causal maps, recent changes, or past incidents), when they start (automatically, proactively, or on request), and how much they're allowed to change on their own.
What makes an AI SRE?
Almost every incident management tool now has AI built in. Most of that is AI that helps you work: it summarizes the Slack channel, drafts the status update or writes the postmortem. It's useful, but it's not what this article is about.
In this blog post, we focus on AI SREs: AI agents that live inside or outside your on-call platform, read your logs, metrics, traces, deployments and code, and return a root-cause hypothesis with evidence when an incident happens.
What we looked at for each tool
For each tool, we looked at four pillars of its AI SRE:
- Investigation depth: how far it goes in finding the root cause, what data it reads, and whether it shows its evidence
- Actions and guardrails: what it can change, and what controls you have over that
- Workflow fit: where it lives, how it connects to on-call, and whether it works with the observability stack you already have
- Privacy and security: what access it needs, what happens to your data, and which model providers process it
Incident management platforms with a built-in AI SRE
These tools build the AI SRE into the platform that already handles your alerts, on-call and incidents, so the investigation starts where the response happens.
ilert AI SRE
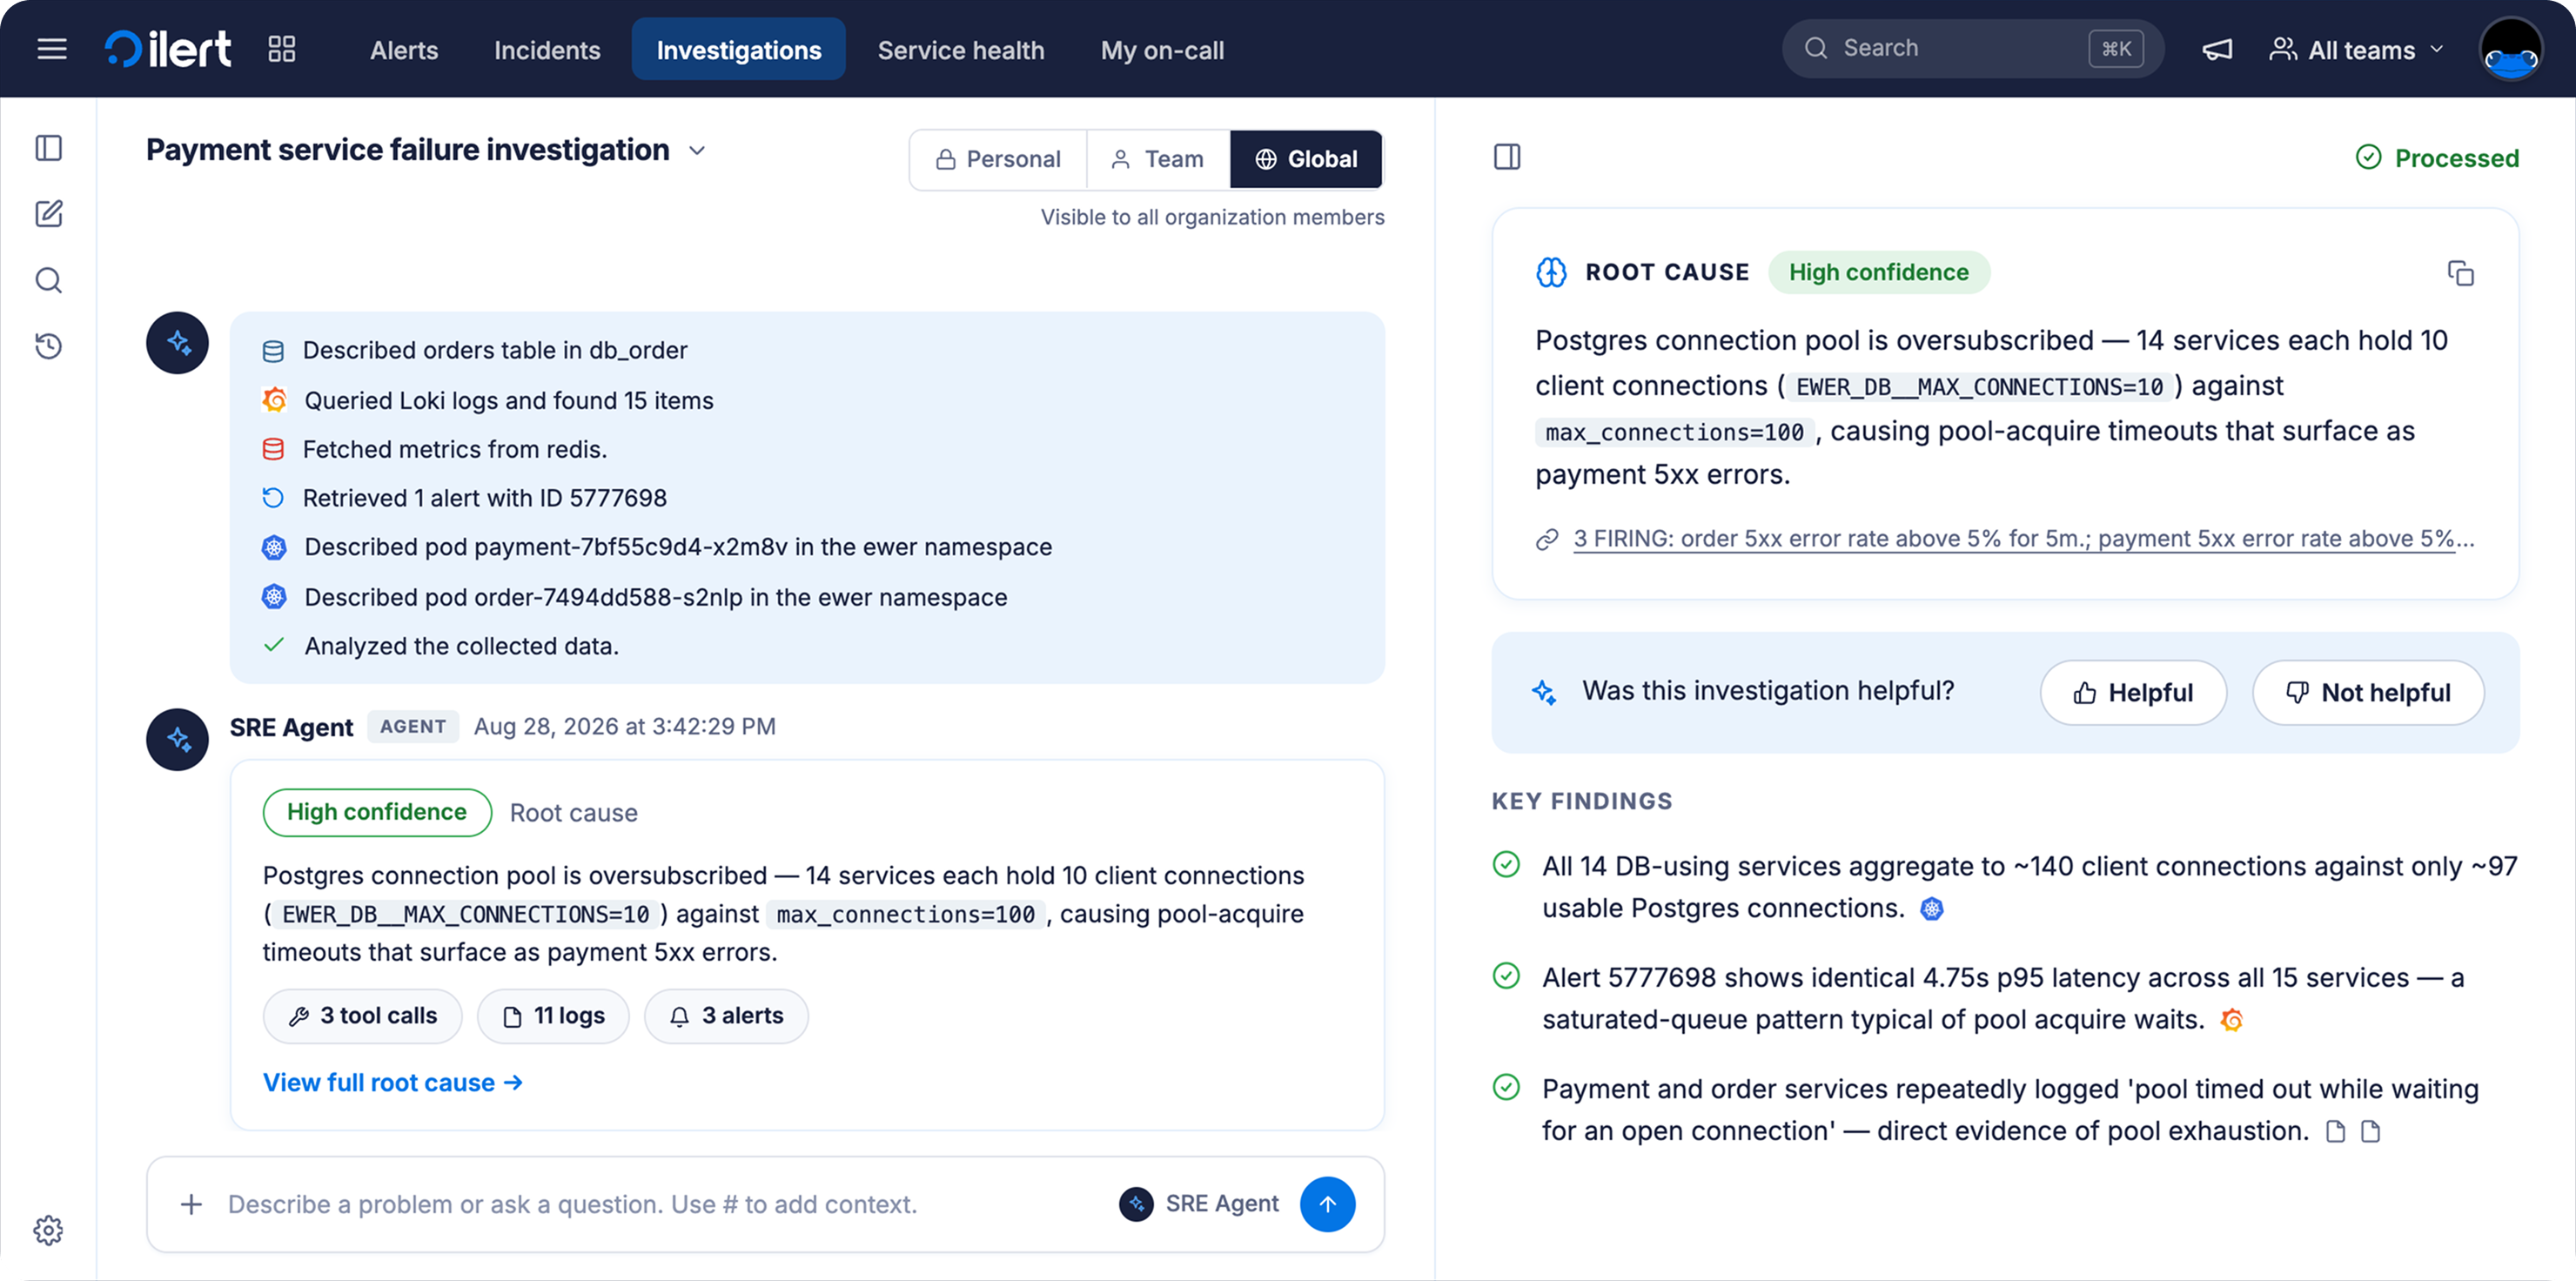
ilert is an incident management platform that covers alerting, on-call scheduling, escalations, status pages and postmortems in one place, with multi-channel alerting by push, SMS, voice and chat apps. Its AI SRE is a module of that platform, bringing agentic incident management into the workflow that already runs your response. When an alert fires, you can launch an investigation and the AI SRE pulls the relevant logs and metrics, correlates the alert with recent deploys, configuration changes and infrastructure state across your existing tools, and forms a hypothesis. It then attaches a specific proposed fix to the live incident, together with the evidence and similar past incidents. Once presented with the evidence, your engineer is the one who makes the call.
ilert’s AI SRE is read-only: it investigates and proposes, but doesn’t execute anything, and every step it takes is logged. Its governance model defines three autonomy levels: L1, investigate and propose, is live today; L2, approved actions, and L3, bounded autonomy, are defined but not yet enabled. Autonomy arrives as a setting you switch on when the track record justifies it.
With 150+ integrations, ilert works with the observability tools you already have. Because the AI SRE is native to the platform that pages the responder and runs the incident, its proposal lands in the live incident alongside who is on call and the escalation state, so there’s no need to switch tabs.
ilert is built in Germany, GDPR-compliant and ISO 27001 certified, with EU data residency. For EU customers, AI SRE runs in ilert’s EU regions, Frankfurt and Stockholm. No data leaves the EU, and nothing is sent to OpenAI’s global endpoints. ilert has opted out of model training with all of its AI providers. Customers outside the EU may use OpenAI or AWS, under strict access controls and encryption.
When to choose ilert AI SRE?
Choose ilert when you want the AI SRE inside the platform that already pages your responders. It's a strong fit for teams that want one platform instead of a growing stack of add-ons, and for regulated EU-based teams that need AI their security team will approve. If you're moving off Opsgenie (end of life April 5, 2027) or the archived Grafana OnCall, ilert's migration CLI reads your existing setup and imports users, teams, schedules and escalation policies, so you land on a platform with the AI SRE built in and don’t migrate twice.
Keep in mind that the AI SRE currently proposes fixes rather than applying them, so teams that want hands-off, autonomous remediation from day one may find other tools a closer fit. For teams that want their AI to earn trust before it touches production, that’s exactly the point. Like any agent, it also only investigates what you connect, so it works best once your logs and metrics are wired in.
PagerDuty SRE Agent
PagerDuty's SRE Agent starts triaging incidents that meet the conditions you set, before anyone has acknowledged them. It summarizes what's happening, pulls in context from related and past incidents and recent changes, and then recommends an action or one of your existing workflows. You can also feed it your own runbooks and define reusable "skills" to guide it.
Like ilert, it keeps responders in control: they approve or override what it runs. The agent lives in Slack, Microsoft Teams and the PagerDuty web app, right on top of PagerDuty's on-call platform.
As one of the longest-standing incident management providers, PagerDuty is explicit about its data policies. Customer data isn't used to train the models behind its SRE Agent.
When to choose PagerDuty?
Choose PagerDuty when it’s already deeply embedded across a large organization and switching platforms isn't realistic. Adding the agent is the smallest change you can make, but keep in mind that it’s included only in PagerDuty’s higher-priced Reliability Platform tiers, where AI usage draws on the same yearly credits as seats and events.
Compare these 2 incident management platforms: ilert vs. PagerDuty.
Observability vendors
These agents work on the telemetry their platform already stores. That gives them deep context inside the platform, but less visibility into what happens outside it.
Datadog Bits AI SRE
Bits AI SRE by Datadog investigates using everything Datadog already holds: from metrics, logs and traces to deployments, source code, database monitoring and the profiler. It weighs competing hypotheses and shows every reasoning step in a detailed view.
When it's time to act, Bits can message your team in Slack or Teams, open incidents and Jira tickets, or page a responder through Datadog On-Call. Admins decide, action by action, whether Bits needs approval or isn't allowed at all. When approval is required, a responder signs off before anything runs.
Bits lives inside Datadog, Slack and the Datadog mobile app, and it works best when your data lives in Datadog. Paging runs through Datadog On-Call, which is sold as a separate product.
Access to Bits follows Datadog's role-based permissions, and Datadog names Anthropic and OpenAI as its AI providers.
When to choose Datadog Bits AI SRE?
Choose Bits when most of your telemetry already lives in Datadog. For data that lives in Datadog, no other agent has that depth of context out of the box. The flip side is that its view largely stops where Datadog’s does: if your data is spread across several vendors, that advantage shrinks, and paging still means adding Datadog On-Call as a separate product.
Dynatrace SRE Agent
Dynatrace builds its investigations on causal AI. Using Smartscape, its real-time dependency graph, it follows the evidence across every signal, rolls related alerts into a single problem and traces it back to code changes, deployments or configuration updates. You get a root cause, the blast radius and a suggested fix.
From there, Dynatrace routes the problem straight to the team that owns the affected component, with no manual dispatch. How much the SRE Agent does on its own is up to you. In Dynatrace's words, it's "autonomous when you want it, human-approved when it matters," and engineers can approve fixes from their phone.
Dynatrace's AI runs on models hosted on Microsoft Azure and AWS Bedrock, and the providers don't train on your prompts. For EMEA customers, AI processing happens in the EU.
When to choose Dynatrace?
Choose Dynatrace when it’s already your observability platform. Its agents depend on Dynatrace’s own topology and data, so they’re hard to beat inside that ecosystem, but teams running more than one observability vendor will only get part of the picture.
Grafana Assistant Investigations
Grafana's Assistant Investigations dig through your metrics, logs, traces and profiles and come back with a report of findings, hypotheses, cited evidence and suggested next steps, building dashboard panels along the way. Unlike some of the tools above, Assistant Investigations don't change anything in your systems; the most they'll do is turn findings into incident updates or backlog items.
Investigations live in Grafana Cloud and Slack, while on-call is handled by a separate product, Grafana IRM.
The Assistant runs on Anthropic's Claude models. Grafana stores your conversation history but never uses your data to train models, and on EU stacks AI processing stays in the EU/EEA.
When to choose Grafana Assistant?
Choose it when you’re already on Grafana Cloud and want investigation that understands your dashboards and queries. Keep in mind that it reports rather than acts, it requires a Grafana Cloud account even if you self-host Grafana, and on-call is a separate product. See how Grafana IRM compares to ilert.
Metoro
Metoro is a Kubernetes observability platform with an AI SRE built in. It collects logs, metrics, traces and profiles with eBPF, so there's no code to change. Its agent ties that data to Kubernetes events and each rollout's commit and pull request to find root causes and check deployments.
The agent can open a fix pull request but never merges it, and its AI runbooks investigate without touching your cluster. Metoro works from its own app, Slack and an MCP server, and hands alerts to on-call tools like ilert instead of paging people itself.
As an observability platform, Metoro does store your telemetry. AI features are opt-in, and AI vendors are contractually barred from training on your data. You can run Metoro in the cloud, in your own cloud or on-prem.
When to choose Metoro?
Choose Metoro when you run on Kubernetes and want monitoring and AI investigation in one product, without adding code to your services. The trade-off is that it’s Kubernetes-focused and means adopting Metoro as your observability platform, so it fits best if you’re starting fresh or ready to switch.
Standalone AI SRE agents
These are standalone agents built specifically for investigation. They connect to your existing observability and on-call tools, which makes them flexible, but it also means one more tool in your incident workflow.
Resolve AI
Resolve AI describes itself as a set of agents that "go on-call on your behalf." They triage alerts, run root-cause analysis, check deploys and tune noisy alerts, and you can even build your own custom agents on top. Like Dynatrace, Resolve either fixes the issue itself or escalates it to a human, depending on the investigation.
The agents work from their own app and in Slack, cover paging too, and connect to a broad list of integrations.
On the privacy side, your telemetry is queried live rather than stored, the agents only get the access you approve, and your data isn't used to train models across customers.
When to choose Resolve AI?
Choose Resolve when you have a complex, multi-vendor stack and want one agent that connects across it, with room to build your own agents on top. Just keep in mind that it’s one more tool next to your incident management and observability platforms, so your team will switch between them during an incident.
Komodor Klaudia
Komodor's Klaudia is a root-cause agent built specifically for Kubernetes. It handles everything from failed containers and cascading errors to add-ons and CRDs, usually returning a diagnosis with a confidence score and evidence, and it remembers past investigations.
Since it can also apply fixes, Komodor's guardrails are worth a closer look. Every agent on the platform runs under the same role-based permissions as your human users, access is limited per integration and per environment, and for each type of action you decide whether to allow it, block it or hold it for approval, with every step logged.
You'll find Klaudia inside Komodor, with Slack, Teams, MCP and IDE integrations, and it's triggered by your on-call tool. When it comes to credentials, agents never hold an exposed key: they get scoped access at run time from a central credential store.
When to choose Komodor Klaudia?
Choose Klaudia when most of your incidents happen in Kubernetes. If your incidents often start outside the cluster, in a database, a third-party API or a deploy pipeline, a general-purpose agent will see more of the picture.
Traversal
Traversal builds what it calls a "Production World Model," a causal map of your systems drawn from the observability tools you already use. It keeps processing production data in the background, so the groundwork is done by the time something breaks. According to Traversal, its causal search can trace a root cause across more than ten hops, from apps down to networking.
Its AI agents, called Workers, join the incident channel on their own, decide when to step in and run the investigation end to end, staying quiet until there is something to flag.
Workers live natively in Slack and Microsoft Teams, and engineers can also call Traversal from Claude Code, Cursor or ChatGPT through its MCP server.
Every integration is read-only, observability data isn't kept after an investigation, and your data isn't used to train models for other customers. You can run Traversal as SaaS, single-tenant or in your own cloud.
When to choose Traversal?
Choose Traversal when you operate at enterprise scale and want an agent that starts investigating on its own across many teams’ services. It’s also a good fit for regulated teams that want it running in their own cloud. For smaller teams it may be more than you need, and like other standalone agents, it adds another tool next to your on-call platform.
Cleric
Cleric focuses its investigations on changes. It checks every change against live traffic for 14 days after it's merged, closes false-positive alerts and digs into the real ones, drawing on sources like Datadog, Prometheus, Grafana, Kubernetes, Sentry and GitHub.
When it finds a cause, it can open a fix pull request and confirm the service has recovered, but it starts read-only, only gets write access "when you're ready," and engineers approve every fix. Cleric works from its own app, Slack and MCP, and reads incident context from PagerDuty while leaving paging and escalations to it.
On the model side, it uses Anthropic, Google Gemini and OpenAI models under contractual no-training terms, and queries raw logs and metrics live rather than storing them.
When to choose Cleric?
Choose Cleric when you want an agent that works before the pager goes off, not just after. It keeps watching production after every deploy and closes false-positive alerts on its own, so it’s a good fit for teams that ship often. Since it leaves paging and escalations to your on-call tool, you’ll still run it alongside your incident platform.
Summary
AI SRE tools differ less in whether they can find a root cause and more in where they live, what they're allowed to change, and what happens to your data along the way. If your telemetry sits with one observability vendor, that vendor's agent will have the deepest context. If your stack is spread across several tools, an agent that connects to all of them, or one built into your incident platform, will see more of the picture. And whichever you choose, check how much the agent can do on its own and where your data goes before you switch it on in production.
See ilert AI SRE on your own incidents. Start a free trial.
FAQ
What is an AI SRE tool?
An AI agent that investigates production incidents. It reads your logs, metrics, traces, deployments and code, and returns a root-cause hypothesis with evidence. It's different from AI features that summarize or draft text.
What data should an AI SRE be connected to?
Start with metrics, logs and traces, plus a feed of deployments and configuration changes. Most of the tools above find root causes by tying an alert to a recent change. Then add source code and pull requests, infrastructure state such as Kubernetes events, and past incidents and runbooks. An agent can only investigate what it can see, so any gap in its access becomes a gap in its findings. Begin with read-only access, limited to the environments it needs to investigate.
Which AI SRE tools are built into an on-call platform?
Several AI SRE tools come from vendors that also run on-call and incident management, so the investigation happens in the same place as paging and escalations. ilert and PagerDuty are examples.
Which AI SRE tools keep data in the EU?
Several vendors offer EU processing for their AI features. ilert runs AI workloads in its EU regions (Frankfurt and Stockholm), Grafana keeps AI processing in the EU/EEA for EU stacks, and Dynatrace processes AI requests for EMEA customers in the EU. Cleric offers an EU hosting option, though some operational data may still leave the EU. Traversal and Metoro can run in your own cloud, so you choose the region. Whichever tool you look at, check where AI processing happens, not just where your data is stored.
What should I ask a vendor about privacy?
Ask what access the agent needs, whether it stores your telemetry, whether your data is used for training, which model providers process it, and where.