Painless Kubernetes monitoring and alerting


Kubernetes is hard, but lets make monitoring and alerting for Kubernetes simple!
At ilert we are creating architectures composed of microservices and serverless functions that scale massively and seamlessly to guarantee our customers uninterrupted access to our services. As many others in the industry we are relying on Kubernetes when it comes to the orchestration of our services. Responding fast to any kind of incident is an absolute must for our uptime platform as every second counts and we like to reduce complexity wherever possible, ilert’s Kubernetes agent and incident actions help us to respond to issues extremely fast.
Introduction
As of today there are many solutions for collecting kubernetes cluster metrics like Prometheus and turning them into graphs and alerts with the help of Grafana. These are great solutions with lots of features and contributions, but there are some problems that go hand in hand with them:
- Complexity (infrastructure setup)
- Complexity (alerting based on graph thresholds)
- Huge resource usage
- Maintenance
- Time to react to an incident
First, the complexity of such monitoring systems means that our goal (to get an alert if a problem occurs) cannot be achieved if one of the monitoring components itself fails. Let’s take a closer look. Suppose I want to be notified if my service or my kubernetes node has reached the memory limit, what do I need for this? The minimum we need is Prometheus, Grafana, kube-state-metrics and node exporter running in my cluster. Then I need to create a Grafana dashboard with the metrics I am interested in and individual alerting conditions for each service, because the memory used for each is different. It is far from easy and adds a whole layer of services that require additionall monitoring. Now if I want to be notified if one of my monitoring system components fails, I need to use HA solutions for it like Cortex, which again adds a whole additional level of complexity to my system.
Besides added complexity and maintenance, the resources used by monitoring systems often exceed the resources consumed by business services (especially in smaller companies or start-ups). This might be normal if we want to achieve transparency in resource usage and performance of our services or if we need to visualize business metrics. But if we just want to get an alert notification regarding a standard problem in our cluster e.g. POD down, it is clearly too much hassle.
The open source community is very active and we are very grateful for them, but this leads to the fact that we get several updates a month and of course we want to use them and we install them on our cluster over and over again. Unfortunately these updates don’t always go smoothly and we have to take the time to deal with the consequences of updates.
At last if a problem occurs, we need to act very quickly so that the customers are not impacted. This is not always easy, especially if you have been asleep for a couple of hours in the middle of the night and need to react asap on an incoming alert, you really want to keep any distraction and friction on a minimum. Besides having to log-in and searching for issues another problem could be the way the monitoring system collects metrics and how the alerts based on aggregated metrics work. For example, if I want to be notified when my service has been terminated (e.g. a bug which causes an NPE or our favorite OOMKilled). Prometheus collects metrics with a certain frequency. Usually it is once every 15 seconds, so in the worst case we lose those 15 seconds if a problem occurs right after Prometheus has once again collected data. After that Grafana processes the data usually every minute and runs a window of last 5 minutes in order to cause an alarm or not. That means in the best case we get an alarm after about a minute that our critical service has been terminated, in some cases after 5 or 10 minutes. Why waste so much time when we can get the information directly from Kubernetes in the same second and react much faster.
So let’s see how we can make our lives easier and separate alerts from metrics with ilert Kubernetes Agent.
Requirements
You will need:
- a Mac / Unix machine
- an ilert account signup now, its free
- a Kubernetes cluster
- potentially an AWS account with AWS Lambda access (if you want to trigger incident actions)
Understanding the setup
Before we start, let’s first understand how it works. In the following example, I want to be notified about problems in my cluster via SMS, Voice or push notifications and respond as quickly as possible to fix the problem.
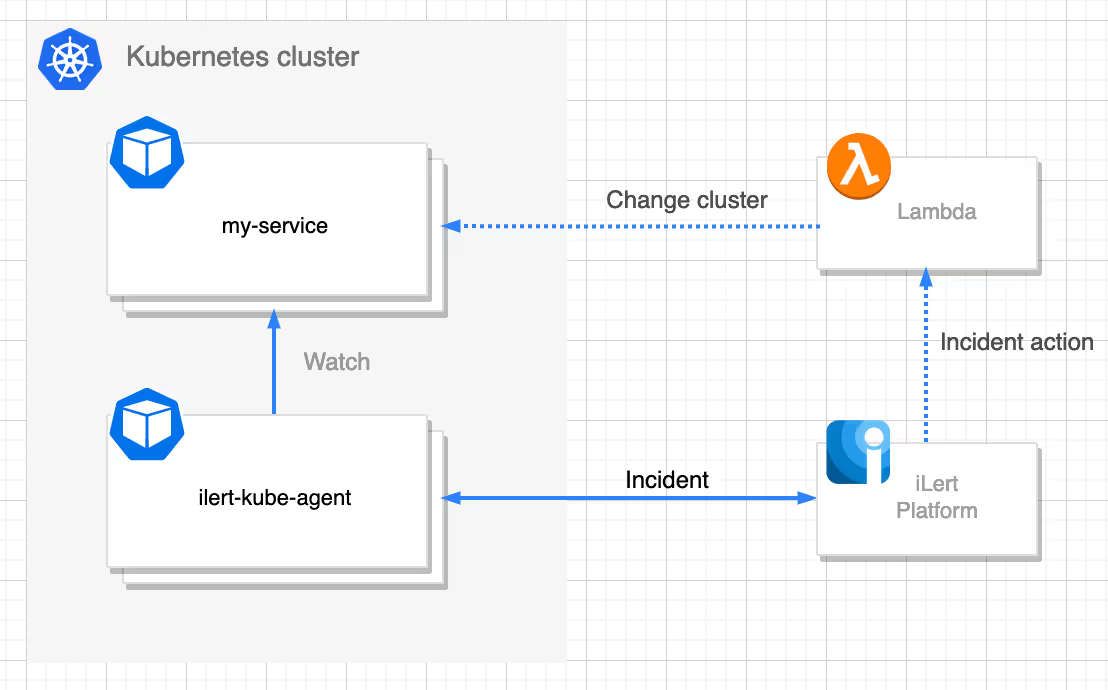
ilert-kube-agent is a service that listens to the Kubernetes API server and generates incidents about the health state of the pods and the nodes. The agent detects the most common problems in the kubernetes cluster and does not require additional configuration. However, it is possible to pass a simple configuration if for example you don’t want to receive a specific type of alert. As soon as a problem is detected, the agent creates an incident in ilert about it. Next comes the reaction to the incident, in this case using a Lambda function, in order to quickly fix the potential problem - without requiring another context switch.
ilert setup instructions
- Go to the “Alert sources” tab and click Create a new alert source
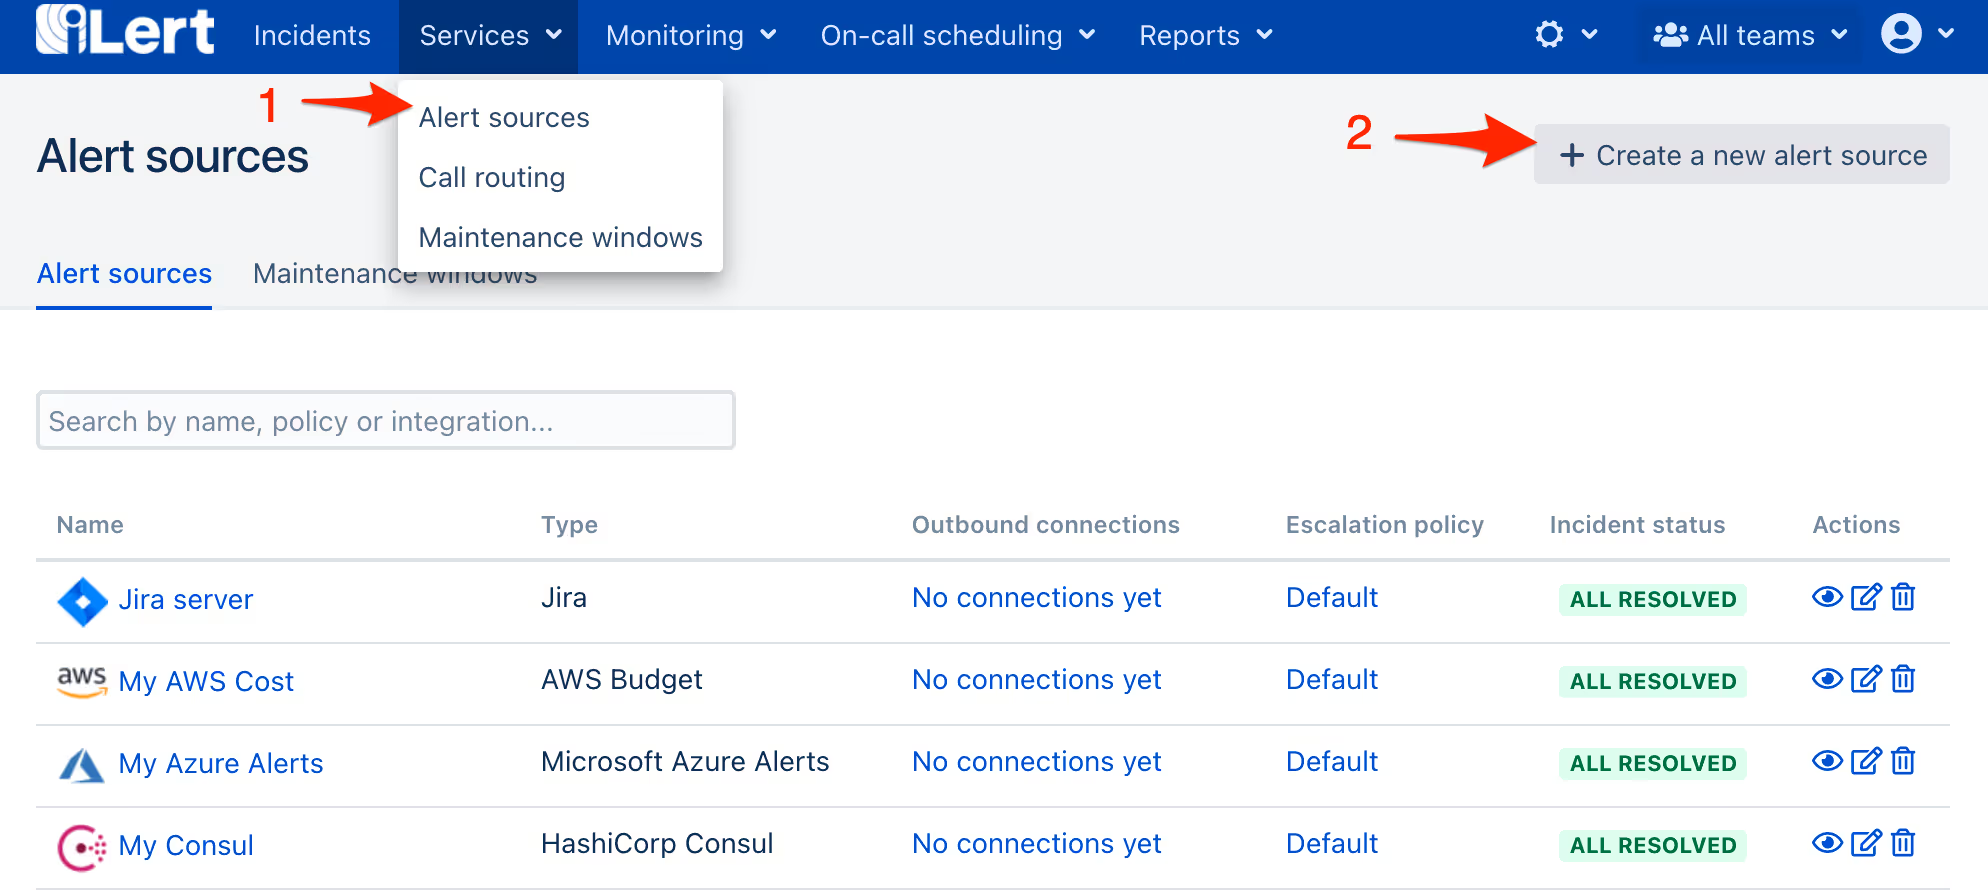
- Enter a name and select your desired escalation policy. Select Kubernetes as the Integration Type and click on Save.
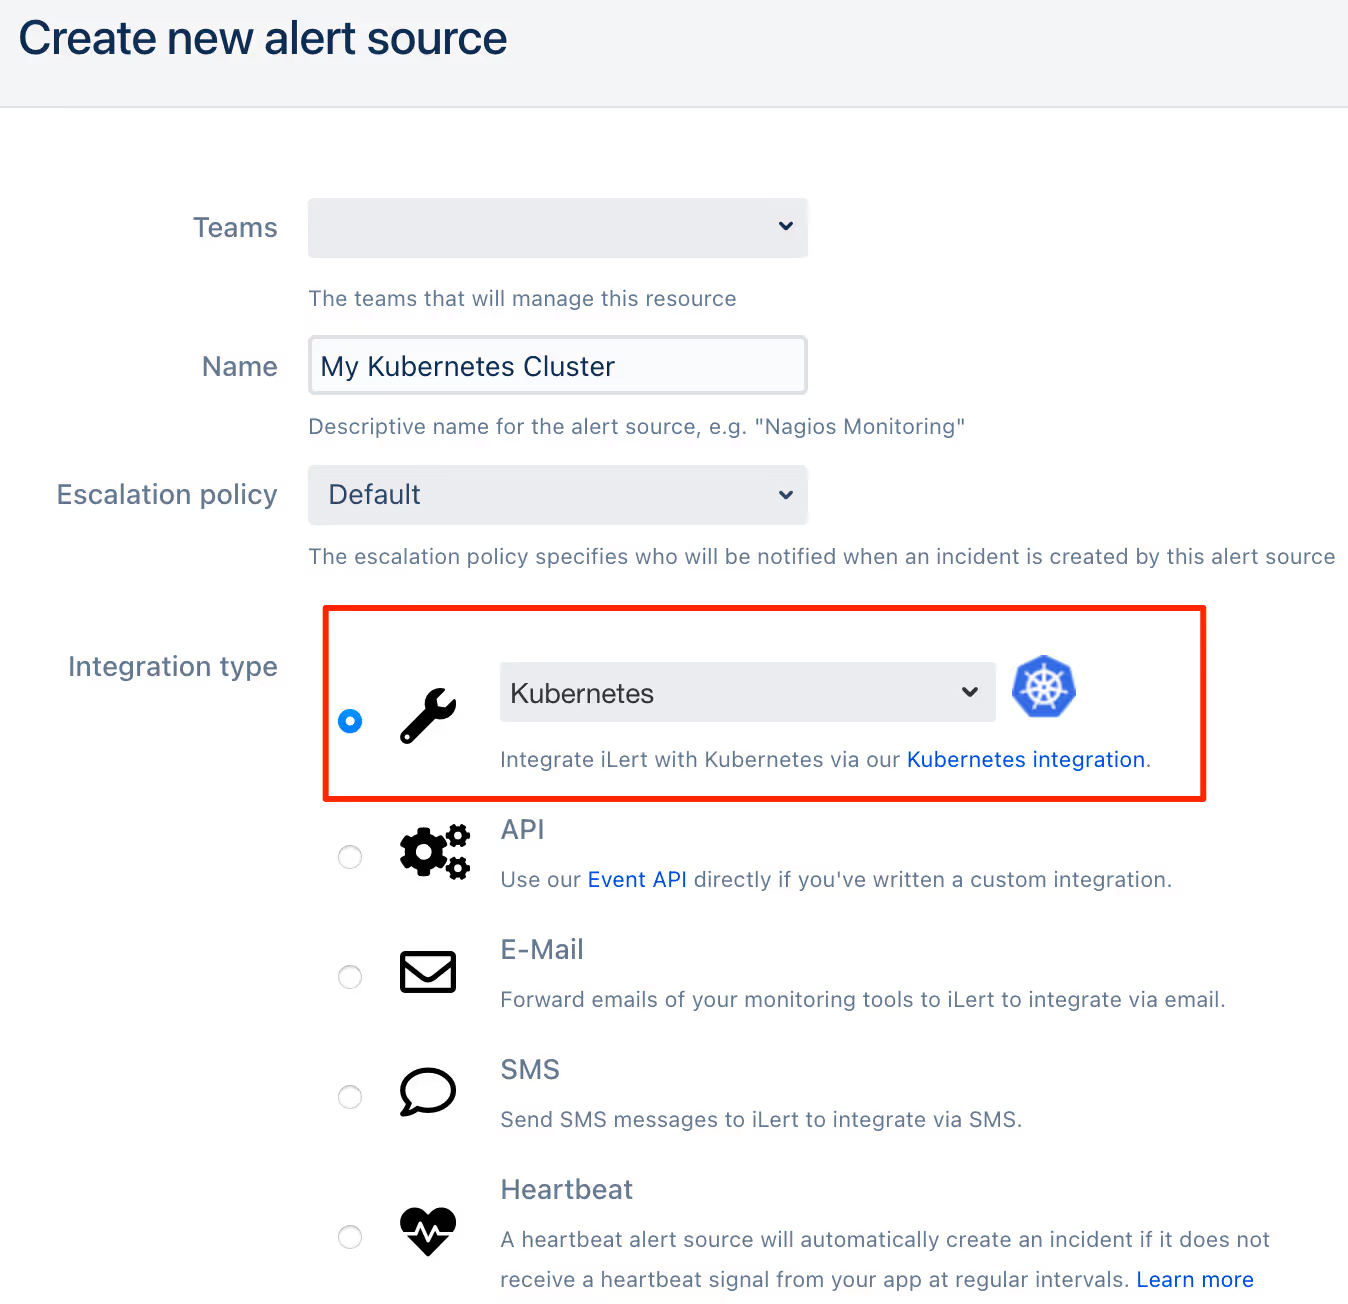
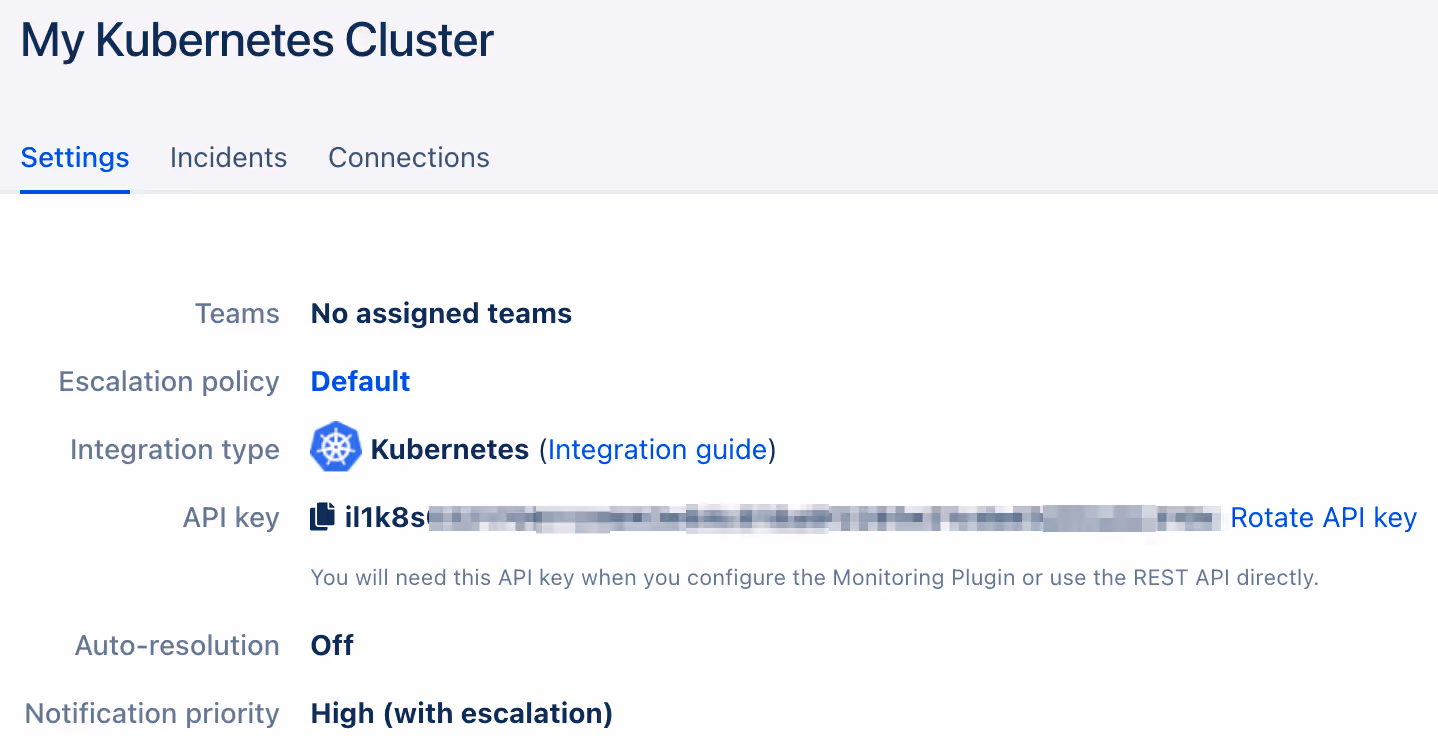
- On the next page, an API Key is generated. You will need it below when setting up the ilert-kube-agent deployment.
Kubernetes Agent setup instructions
In this example I will use the helm setup. If you’re considering an installation with a simple yaml manifest or Terraform or Serverless (Lambda), you can refer to our instructions here
- Add the helm charts repo and update it
- Deploy the agent with the API Key that you have generated in ilert
- Verify your agent installation
Finished! Now Kubernetes events will create incidents in ilert.
Incident action setup instructions
for the sake of this demonstration we are using AWS Lambda, you may use any other externally triggerable resource
In order to respond to an incident with incident actions in our kubernetes cluster, we need to create a Lambda connector and incident action for our Kubernetes alert source in ilert. The first thing to do is to create a Lambda function in AWS. For our demonstration purposes, I have created this repository, which contains a simple Lambda function with the utils to scale our deployment or statefulset.
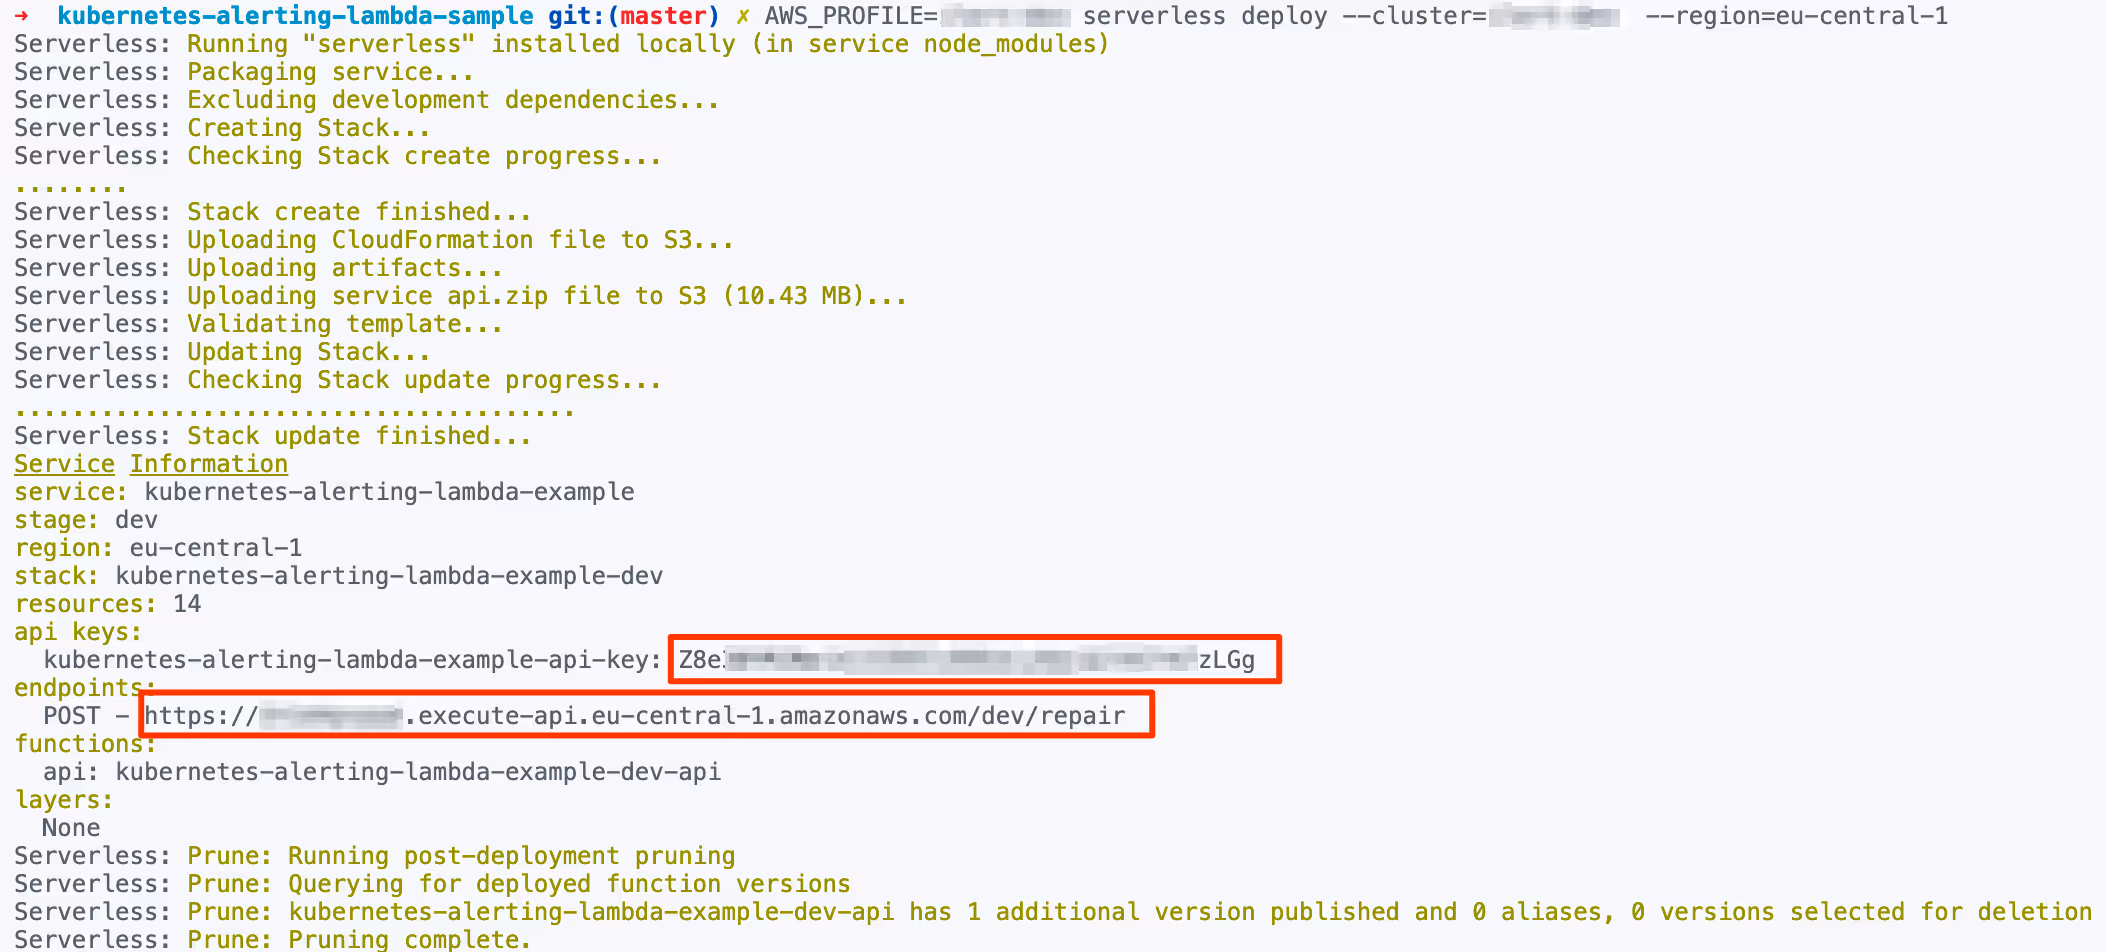
- Deploy Lambda API
- After the deployment, a Lambda URL and an Authorization API Key are generated. You will need it below when setting up the connector and incident action in Ilert.
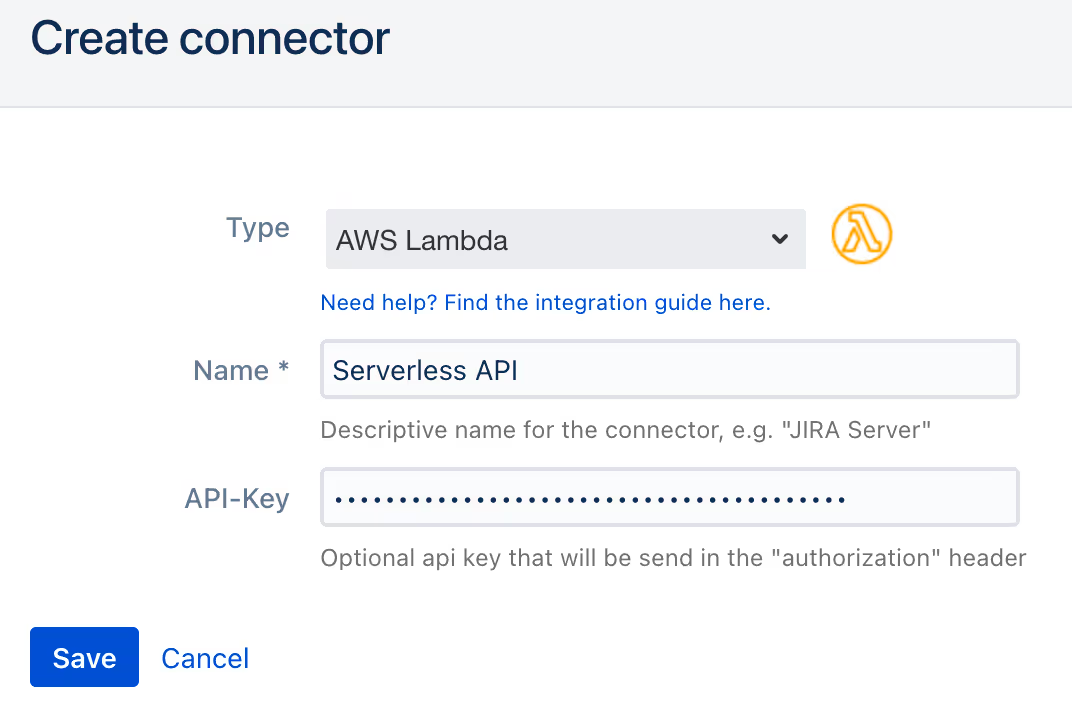
- Go to the Connectors page of your ilert account and click on the Create connector
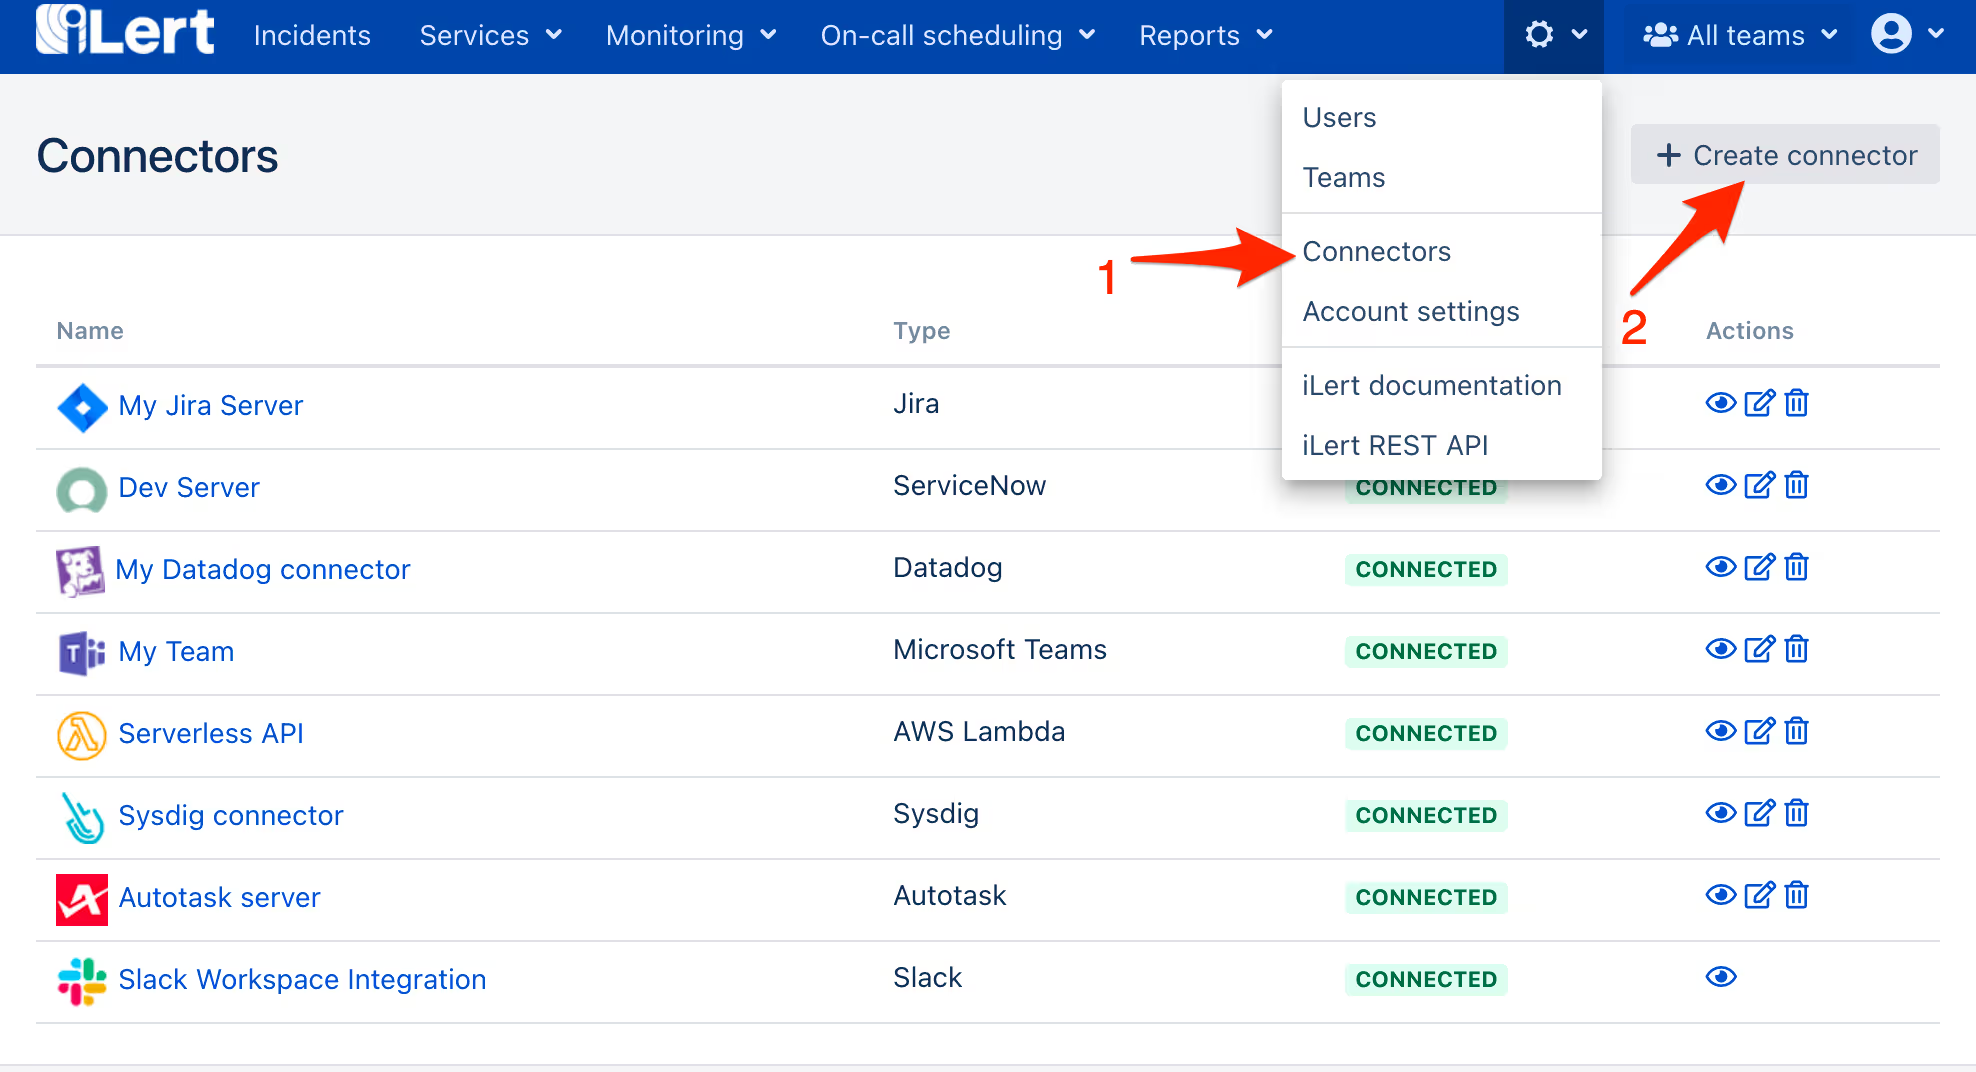
- On the next page, name the connector e.g. Serverless API, choose AWS lambda as type and paste the Authorization API Key that you generated in the step 2.
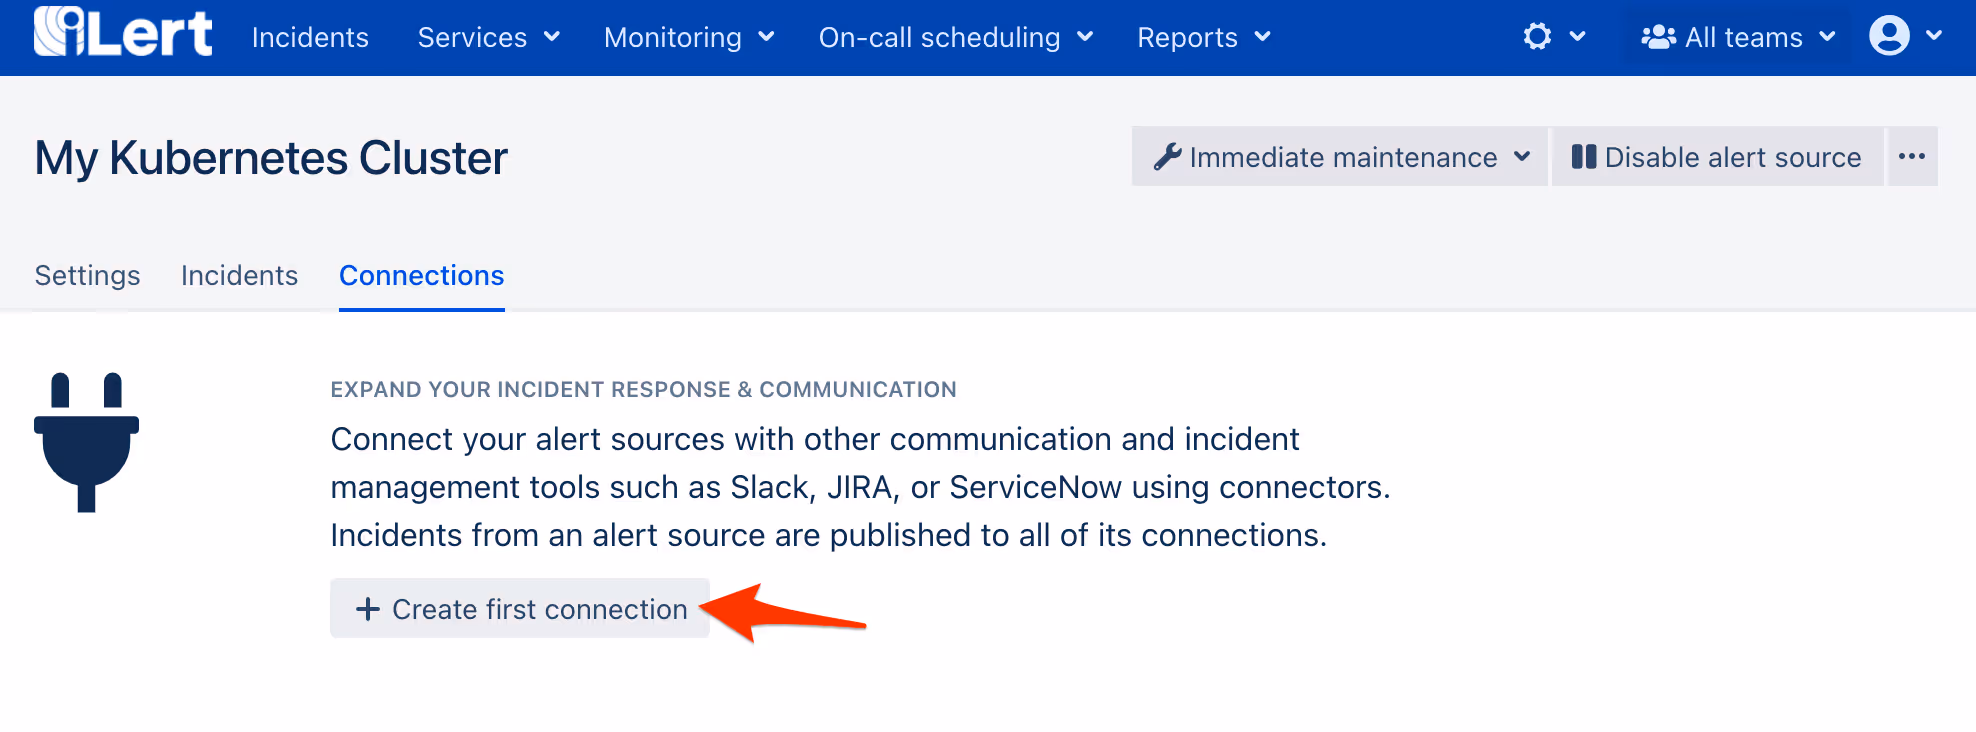
- Go to our Kubernetes alert source that you have created before and navigate to the incident actions tab, then click on the Create first incident action button.
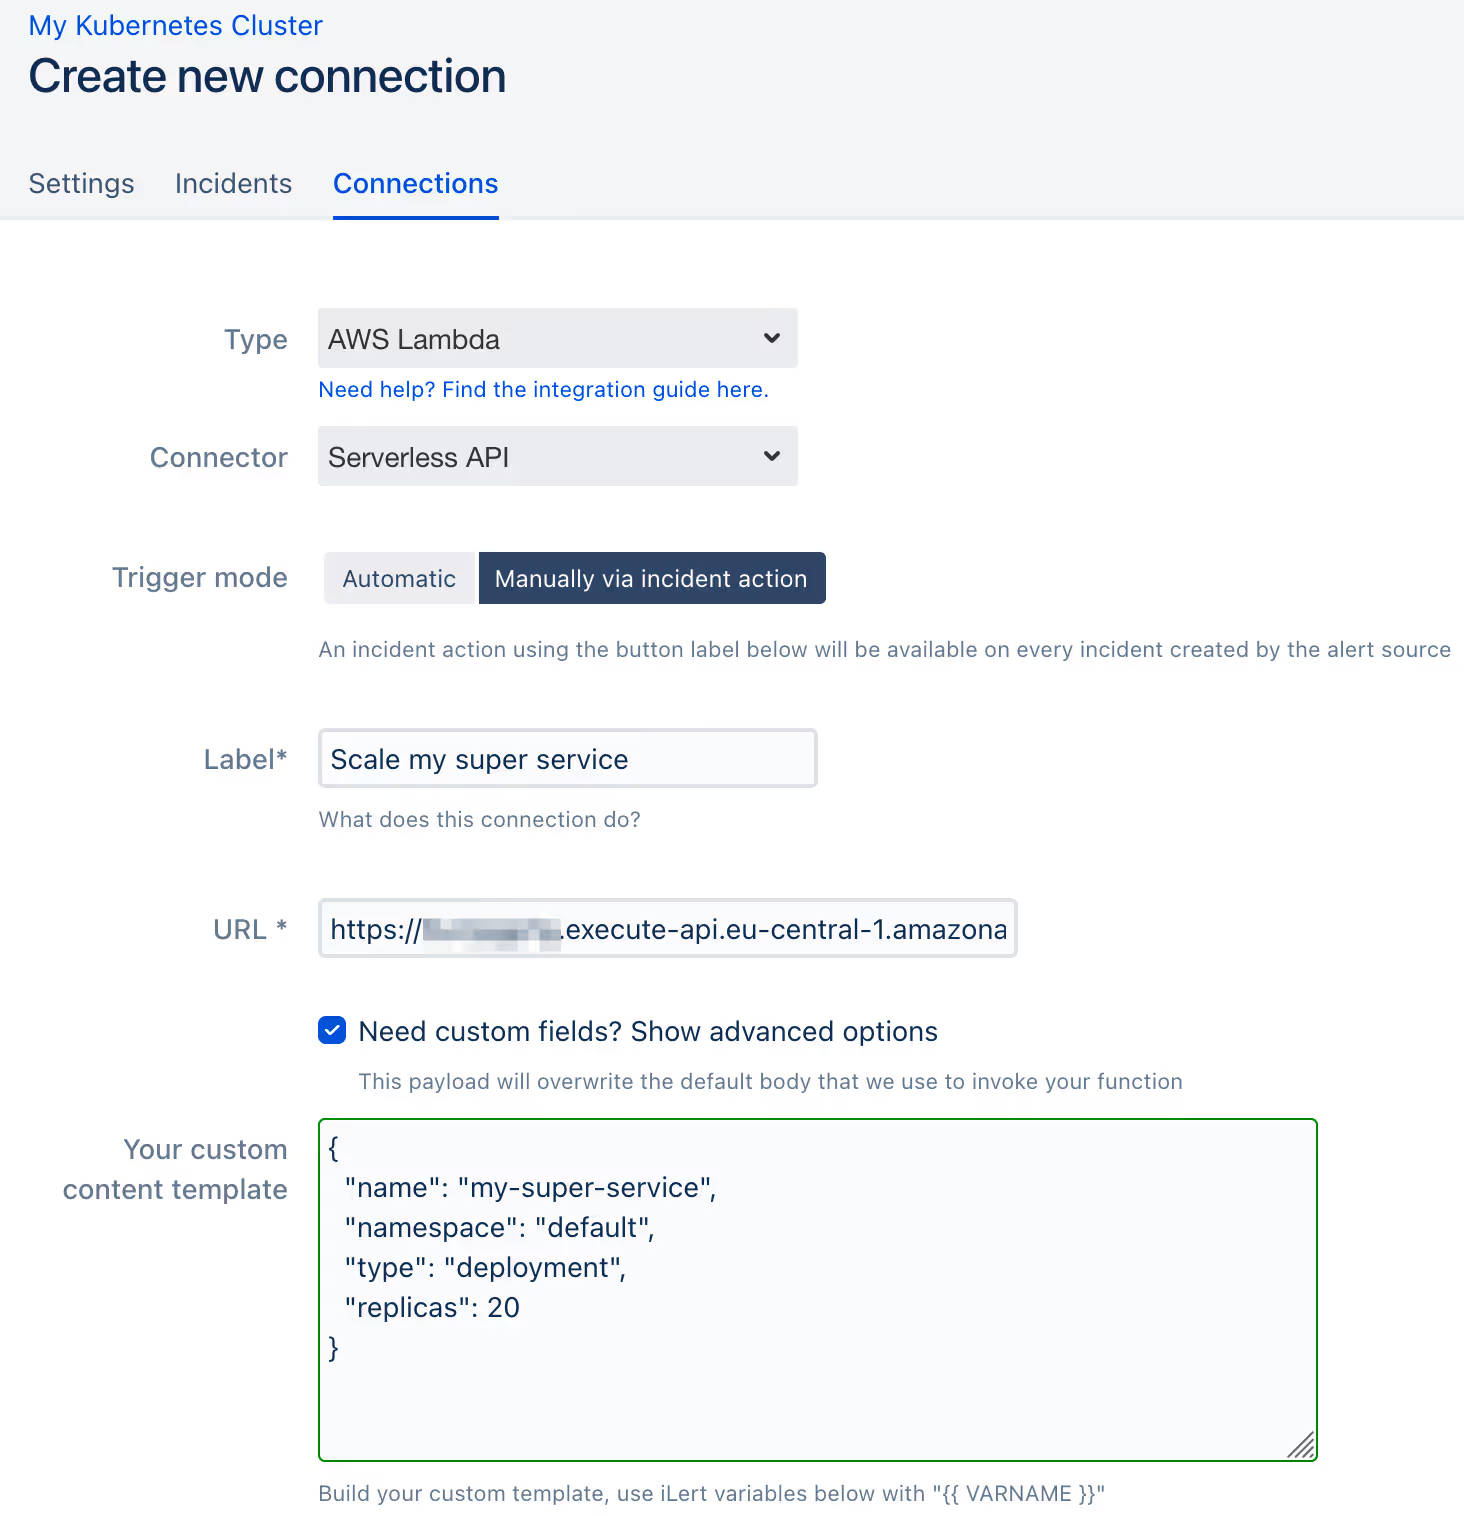
- On the next page, choose AWS lambda as type, choose the connector that you have just generated, choose Manually via incident action as trigger mode, name the incident action e.g. Scale my service, paste the Lambda URL that you generated in the step 2 and paste the custom content template:
We are now able to react to each kubernetes incident with a quick incident action from within ilert.
Responding to alerts
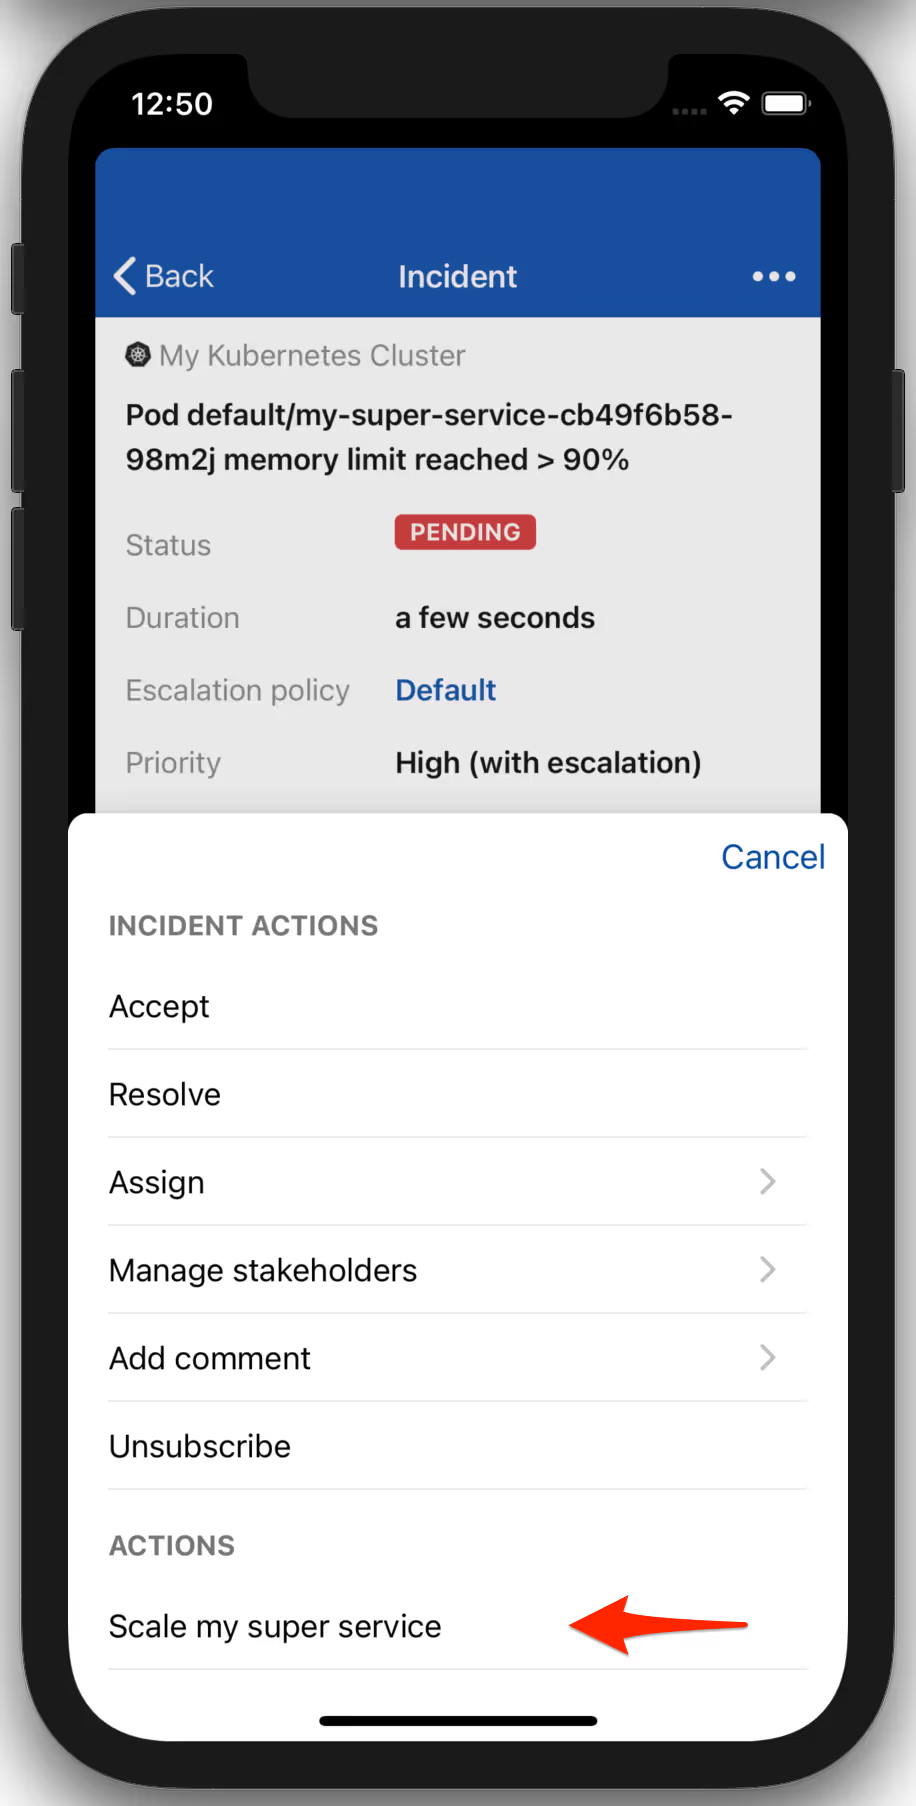
Now let’s see our setup in practice. In this example we get an alert that our service uses and increased amount of memory, probably because it has to process more traffic than usual. I want to spread the load off this service as soon as I get a notification about this problem and analyse the issue afterwards.

As you can see I used the incident action that we created before to solve the problem, right from my smartphone.
Checking the status of our service in Kubernetes, we see that it has more replicas now.
Conclusion
Of course not all problems are solved by scaling or rolling back, but response time is always critical to a successful business.
Our experience with different sized clusters and monitoring systems shows that you should not always rely on a single solution, even a very popular and well-established one. Solving a day-to-day problem in the shortest and most efficient way can make your life a lot easier.

.avif)